Si vous vous fiez encore uniquement à la résistance en courant continu pour surveiller la performance, vous manquez les points de données les plus critiques. Mesure de la fréquence de la batterie est la norme professionnelle pour découvrir la dégradation interne cachée que les méthodes traditionnelles ne peuvent tout simplement pas détecter.
En tirant parti de la Spectroscopie d'Impédance Electrochimique (EIS) et les tests d'impédance en courant alternatif, vous pouvez cartographier l’empreinte unique d’une batterie pour l’évaluer avec précision État de santé (SoH), État de charge (SoC), et la longévité à long terme. Que vous gériez le diagnostic des véhicules électriques, les systèmes d’alimentation sans interruption (ASI), ou le stockage d’énergie renouvelable, maîtriser la réponse dépendante de la fréquence est la clé pour la maintenance prédictive et la fiabilité du système.
Dans ce guide complet, vous apprendrez exactement comment mettre en œuvre ces techniques de diagnostic avancées pour obtenir des résultats de qualité laboratoire sur le terrain.
Allons droit au but.
Comprendre l'impédance de la batterie et les bases de la réponse en fréquence
La mesure de la fréquence de la batterie est la base du diagnostic moderne. Lorsque nous parlons de « fréquence » dans le contexte d’une batterie, nous ne faisons pas référence à la sortie AC d’un onduleur. Au contraire, nous examinons comment la chimie interne d’une batterie réagit aux signaux à travers un spectre. Cela se mesure par impédance de la batterie, qui est l'opposition totale qu'un circuit offre au flux de courant alternatif (AC).
Concepts clés : Résistance vs. Réactance
Pour évaluer précisément une batterie, nous devons distinguer entre résistance simple et impédance complexe :
- Résistance Interne : L'opposition physique au flux de courant à l'intérieur de la batterie (lamelles, collecteurs et électrolyte).
- Réactance : Le « décalage » causé par les processus chimiques et les effets de stockage électrique (capacitance) ou de champs magnétiques (inductance).
- Impédance (Z) : La combinaison des deux. En mesurant comment l’impédance change à différentes fréquences, nous pouvons « voir » à l’intérieur de la cellule sans l’ouvrir.
Pourquoi la fréquence est importante pour la santé de la batterie
Différents processus physiques et chimiques à l'intérieur d'une batterie se produisent à des vitesses différentes. En mesurant la fréquence de la batterie, nous pouvons isoler des problèmes spécifiques :
- Hautes fréquences (kHz) : Révèlent l'état des connexions physiques et la conductivité de l'électrolyte.
- Basses fréquences (mHz) : Exposent des tendances chimiques profondes, telles que la résistance au transfert de charge et la diffusion des ions.
Test de résistance interne AC vs. DC
Alors que les deux méthodes visent à mesurer la santé interne, elles offrent différents niveaux d'informations :
- Résistance Interne en Courant Continu (DCIR) : Utilise une impulsion de courant fort. Elle est utile pour les statistiques de livraison de puissance mais peut être lente et potentiellement invasive pour la chimie de la cellule.
- Résistance Interne en Courant Alternatif (ACIR) : Utilise un petit signal AC non destructif. Il fournit une empreinte plus nuancée de l’état interne de la batterie.
La norme industrielle de 1 kHz
Dans le monde des batteries, le test d’impédance à 1 kHz est la référence pour des vérifications rapides de la santé. C’est la fréquence la plus couramment utilisée pour :
- Tri et Classement : Identifier rapidement les cellules « faibles » en production.
- Contrôle Qualité : Vérifier que les connexions internes sont sécurisées.
- Diagnostic sur le terrain : Fournir une vue rapide de la vérification de la santé de la batterie sur le terrain sans nécessiter une analyse complète en laboratoire.
Chez Nuranu, nous exploitons ces insights dépendants de la fréquence pour fournir des diagnostics de haute précision qui vont au-delà des simples vérifications de tension, en assurant que chaque cellule de votre système fonctionne à son meilleur.
Spectroscopie d’Impédance Electrochimique (EIS) pour l’Analyse de Batterie
La Spectroscopie d’Impédance Electrochimique (EIS) est la méthode la plus efficace pour mesurant la fréquence de la batterie réponses à travers un large spectre. En appliquant de petits signaux AC à différentes fréquences — allant du millihertz (mHz) au kilohertz (kHz) — nous pouvons capturer une carte détaillée du comportement électrochimique interne d’une batterie. Ce processus permet de séparer différents phénomènes physiques, tels que la résistance ohmique, le transfert de charge et la diffusion d’ions, qui sont autrement regroupés dans des tests DC standard.
L’utilisation de l’EIS crée une « empreinte digitale » numérique de la cellule. Ces données haute résolution offrent des insights approfondis sur l’état interne de la batterie, notamment :
- Résistance de l'électrolyte : Identifier comment la conductivité de l'électrolyte évolue dans le temps.
- Croissance de la couche SEI : Surveillance de l'Interphase d'électrolyte solide, qui est l'une des deux principales raisons affectant la durée de vie des batteries au lithium 18650.
- Résistance au transfert de charge : Mesurer l'efficacité des réactions chimiques à l'interface électrode-électrolyte.
- Transport/Diffusion de masse : Comprendre comment les ions se déplacent à travers les matériaux actifs (impédance de Warburg).
Pour la R&D avancée et le contrôle qualité, l'impédance AC de la batterie les données sont indispensables. Il offre un moyen non destructif d'évaluer packs de batteries et les cellules individuelles dans des conditions réelles. En analysant la réponse en fréquence, nous pouvons identifier indicateurs de dégradation de la batterie bien avant qu'ils n'entraînent une défaillance totale. Cette précision fait de la SIE l'outil principal pour le haut niveau Estimation de l'état de charge (SoC) et de l'état de santé (SoH) et garantit que chaque cellule d'un système répond à des normes de performance rigoureuses.
Équipement essentiel pour mesurer la fréquence de la batterie
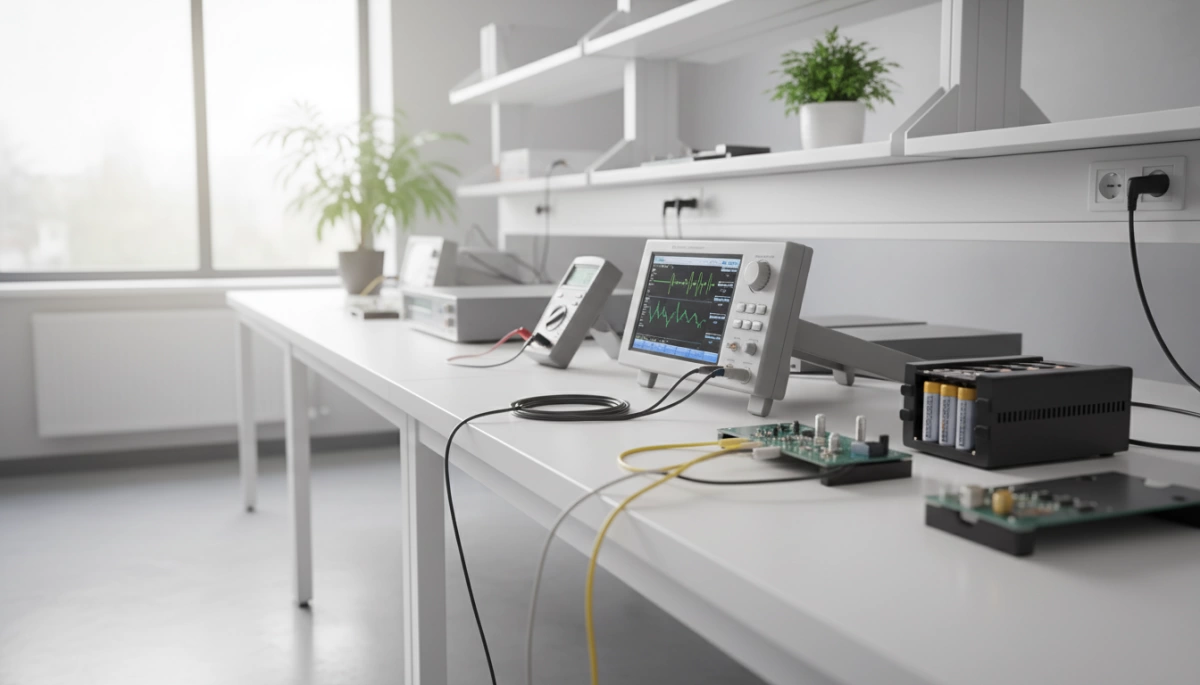
Pour obtenir des données précises, vous avez besoin du bon équipement. Pour des vérifications de terrain de base, les testeurs de batterie portables offrent un aperçu rapide de la résistance interne. Cependant, pour un profil de santé complet, nous utilisons des analyseurs de réponse en fréquence de haute précision capables de balayages complets de Spectroscopie d'Impédance Électrochimique (EIS). Ces outils nous permettent d'aller au-delà d'un seul point de données et de voir l'état chimique complet de la cellule.
Choisir les bons outils de diagnostic
| Caractéristique | Testeur portatif | Analyseur d'impédance EIS |
|---|---|---|
| Utilisation principale | Maintenance sur le terrain et vérifications rapides | R&D et diagnostics détaillés |
| Plage de fréquence | Fixe (généralement 1 kHz) | Bande large (mHz à kHz) |
| Précision | Résolution standard | Résolution en micro-ohms |
| Sortie de données | Valeur ohmique simple | Graphiques complets de Nyquist/Bode |
Fonctionnalités de précision et sondes Kelvin
Nous utilisons toujours Sondes Kelvin à 4 bornes pour les tests dépendants de la fréquence. Cette configuration est non négociable car elle élimine la résistance des câbles de test eux-mêmes, garantissant que la mesure provient strictement de la chimie de la batterie. Un équipement de haute précision avec une résolution en micro-ohms est essentiel lorsque nous testons un Bloc de batterie lithium 3,7V 1,8Ah 18650 où de petites variations d'impédance annoncent le début de la dégradation.
Utilisation en laboratoire vs. utilisation sur le terrain
Les unités portables d'ESI sont désormais la référence pour le diagnostic des batteries sur site. Elles offrent la portabilité d'un appareil de poche avec la profondeur de données d'un équipement de laboratoire. Cela est vital lors de la surveillance d'un Batterie lithium 7,4V 5Ah 18650 pour les collecteurs de données environnementales dans des endroits isolés. Alors que les laboratoires utilisent des bancs stationnaires pour la caractérisation à long terme, les analyseurs prêts pour le terrain nous permettent d'effectuer un test d'impédance à 1 kHz ou une balayage complet de fréquence sans retirer la batterie de son application.
Guide étape par étape pour mesurer la fréquence de la batterie

Mesurer la fréquence de la batterie par le biais de la Spectroscopie d'Impédance Electrochimique (EIS) nécessite une combinaison de matériel précis et une exécution systématique. Que vous analysiez une seule cellule ou un pack haute tension, le processus doit être non destructif et très précis pour fournir des données exploitables sur la santé.
1. Sécurité et préparation
Avant de commencer toute mesure de résistance interne, assurez-vous d'être équipé d'EPI appropriés pour la manipulation de haute tension. Nos plateformes de diagnostic sont conçues pour la sécurité, mais vous devez vérifier que les bornes de la batterie sont propres et exemptes de corrosion. Pour ceux qui travaillent avec des configurations spécifiques, telles que le choix d'une batterie lithium 18650 ou d'une batterie lithium-polymère pour votre véhicule électrique, comprendre les limites de tension spécifiques de votre pack est la première étape d'un test réussi.
2. Éliminer la résistance des câbles avec des pinces Kelvin
Pour obtenir une lecture fidèle de la chimie interne d'une batterie, vous devez éliminer la résistance des fils de test eux-mêmes. Nous utilisons Sondes Kelvin à 4 bornes (pinces Kelvin) pour séparer les fils de courant des fils de détection de tension. Cette configuration garantit que la réponse en fréquence que vous mesurez reflète l'état interne de la batterie, et non la qualité de vos câbles.
3. Sélection de la plage de fréquences
Choisir la bonne plage est essentiel pour une mesure précise la vérification de la santé de la batterie.
- Basses fréquences (plage mHz) : Idéal pour capturer les caractéristiques de transport de masse et de diffusion.
- Fréquences moyennes à élevées (plage Hz à kHz) : Idéal pour mesurer la résistance au transfert de charge et la résistance ohmique.
- Analyse à large bande : Pour une « empreinte » complète, nous recommandons une balayage à travers tout le spectre pour capturer le graphique de Nyquist complet.
4. Balayages EIS à fréquence unique vs. complets
- Fréquence unique (1 kHz) : Une méthode de « vérification rapide » souvent utilisée pour un tri rapide ou des Résistance interne AC vérifications de base. Elle fournit un instantané, mais passe à côté des informations chimiques plus approfondies.
- Balayages EIS complets : C'est notre référence absolue. En balayant un large spectre de fréquences, nous pouvons identifier des marqueurs de dégradation spécifiques tels que la croissance de la couche SEI ou l'appauvrissement de l'électrolyte.
5. Acquisition et intégration des données
Une fois la mesure lancée, notre matériel de haute précision capture les données d'impédance en temps réel. Ces données brutes sont introduites dans notre logiciel basé sur le cloud, qui automatise les calculs mathématiques complexes nécessaires pour l'estimation de l'état de charge (SoC) et de l'état de santé (SoH). Le résultat est un rapport de diagnostic clair qui vous indique exactement la durée de vie restante de votre batterie et où se situent les goulots d'étranglement.
Interprétation des résultats : Analyse des données de fréquence de la batterie
Une fois les données collectées, nous traduisons la réponse en fréquence brute en une image claire de l’état de santé de la batterie. Mesure de la fréquence de la batterie par le biais de la Spectroscopie d’Impédance Electrochimique (EIS), fournit deux outils visuels principaux : le graphique de Nyquist et le graphique de Bode. Ce ne sont pas seulement des graphiques ; ce sont les « empreintes internes » de votre système de stockage d’énergie.
Comprendre le graphique de Nyquist
Le graphique de Nyquist est la méthode la plus courante pour visualiser l’impédance de la batterie. Il trace l’impédance imaginaire contre l’impédance réelle sur l’ensemble du spectre de fréquence.
- L’interception à haute fréquence : Cela montre la résistance purement ohmique (électrolyte et collecteurs de courant).
- Le semicercle : Cela représente le résistance au transfert de charge et la couche SEI. Un semicercle qui s’élargit avec le temps est un indicateur clair de vieillissement ou de dégradation.
- La queue de Warburg : La ligne à 45 degrés à basse fréquence indique la diffusion des ions. Si cette queue se déplace de manière significative, cela indique souvent des problèmes de transport de masse au sein de la cellule.
Graphiques de Bode pour l’analyse de phase
Alors que le graphique de Nyquist est idéal pour une vérification rapide de l’état de santé, l’analyse par graphique de Bode est essentielle pour la précision. Il cartographie la magnitude de l’impédance et le déphasage en fonction de la fréquence. Cela nous permet de déterminer précisément à quelle fréquence la batterie passe d’un comportement résistif à un comportement capacitif, ce qui est crucial pour l’optimisation d’un Système de Gestion de Batterie (BMS).
Relier les données à l’estimation du SoC et du SoH
Nous utilisons ces métriques pour aller au-delà des simples vérifications de tension. En analysant les décalages de fréquence, nous pouvons atteindre une haute précision Estimation de l'état de charge (SoC) et de l'état de santé (SoH). Par exemple, lors du test d’un batterie lithium-ion 18650, un décalage dans le diamètre du semicercle est directement lié à une perte de densité de puissance, offrant une méthode plus fiable état de santé de la batterie métrique plus précise que les tests de décharge traditionnels.
Dépannage des anomalies courantes
Les données ne sont pas toujours parfaites. Lors de l’interprétation des résultats, nous recherchons ces « signaux d’alerte » courants :
- Boucles inductives : Souvent causées par de longs câbles ou de mauvaises connexions, apparaissant sous forme de points en dessous de l'axe x à haute fréquence.
- Dispersion/Bruit : Suggère généralement une interférence électromagnétique (EMI) ou une batterie qui n’a pas atteint l’équilibre chimique.
- Intercepts décalés : Indique généralement une connexion lâche ou une défaillance de la connexion plutôt qu'une dégradation interne de la cellule.
En maîtrisant ces tracés, nous transformons des signaux électrochimiques complexes en programmes d'entretien et de remplacement exploitables.
Applications concrètes de la mesure de la fréquence de la batterie

Nous appliquons des diagnostics basés sur la fréquence dans divers secteurs pour garantir la fiabilité et la sécurité de l'alimentation. En analysant la réponse d'une batterie à des fréquences spécifiques, nous dépassons les simples vérifications de tension pour une compréhension plus approfondie de la santé interne.
Infrastructures critiques et centres de données
Dans des environnements comme les centres de données et les systèmes d'alimentation sans coupure (UPS), l'échec n'est pas une option. Nous utilisons diagnostics de batterie EIS pour effectuer des tests sur le terrain non destructifs. Cela nous permet d'identifier les cellules à haute résistance dans une chaîne sans mettre tout le système hors ligne. Si un système de secours échoue à une analyse de fréquence, savoir Comment savoir si votre batterie est morte devient la première étape critique pour éviter une coupure totale de l'installation.
Diagnostics pour véhicules électriques et systèmes de stockage d'énergie (SSE)
Pour les véhicules électriques et le stockage d'énergie à grande échelle, mesurant la fréquence de la batterie est la méthode la plus efficace pour suivre la dégradation.
- Évaluation rapide : Nous utilisons la réponse en fréquence pour trier rapidement les batteries « seconde vie » en vue de leur réutilisation dans les ESS.
- Surveillance du pack de traction : Identifier les défauts internes comme le dépôt de lithium ou la croissance de dendrites avant qu'ils ne deviennent des risques pour la sécurité.
- Efficacité : L'EIS permet une acquisition de données plus rapide que les cycles de charge/décharge traditionnels.
Intégration et conformité du BMS
Les systèmes modernes de gestion de batteries (BMS) intègrent de plus en plus la mesure en fréquence pour une surveillance continue. Cette intégration permet une Estimation de l'état de charge (SoC) et de l'état de santé (SoH), fournissant aux gestionnaires de flotte des données précises sur la durée de vie restante. Pour que nos données soient reconnues mondialement, nos protocoles de mesure s'alignent sur les normes IEC, offrant un cadre standardisé pour la résistance interne et les métriques de santé. Cette approche professionnelle garantit que chaque diagnostic que nous effectuons répond aux exigences rigoureuses des marchés de l'énergie et du transport en France.
Stratégies avancées pour la mesure de la fréquence des batteries
Pour tirer le meilleur parti de mesurant la fréquence de la batterie, nous devons aller au-delà des lectures de base et nous concentrer sur les nuances des différentes chimies et facteurs environnementaux. Notre approche de la Spectroscopie d'Impédance Electrochimique (EIS) varie selon que nous analysons des systèmes lithium-ion ou plomb-acide, car chacun possède une signature chimique unique.
Sélection de la fréquence par type de batterie
Choisir la bonne plage de fréquence est essentiel pour un diagnostic précis de l'état de santé de la batterie.
- Lithium-Ion : Nous effectuons généralement des balayages à large bande de millihertz (mHz) en kilohertz (kHz). Cela nous aide à voir l'ensemble du tableau, de la résistance de l'électrolyte au transfert de charge aux électrodes. Par exemple, lors de l'évaluation de ce qui est meilleur, une batterie lithium 18650 ou 21700, nous utilisons des réponses en fréquence spécifiques pour identifier comment la forme plus grande influence la résistance interne et la dissipation thermique.
- Plomb-acide : Ces batteries nécessitent souvent des analyses à basse fréquence pour détecter des problèmes comme la sulfation ou la dégradation des plaques, qui se produisent à un rythme chimique plus lent que les réactions au lithium-ion.
Surmonter le bruit de mesure et la température
EIS de batterie est très sensible. Pour garantir la fiabilité des données, nous suivons des meilleures pratiques strictes pour gérer les interférences externes :
- Contrôle de la température : La résistance interne fluctue avec la température. Nous normalisons toujours nos données à une température standard (habituellement 25°C) pour éviter des résultats déformés du SoH (État de Santé).
- Réduction du bruit : Les environnements à haute tension, comme les packs de véhicules électriques ou le stockage sur réseau, génèrent un bruit électrique important. Nous utilisons des câbles blindés et des logiciels de filtrage avancés pour maintenir le signal propre.
- Intégrité de la connexion : Une pince lâche peut ajouter des milliohms de résistance « factice ». Nous utilisons des sondes Kelvin à 4 bornes de haute précision pour contourner complètement la résistance des câbles.
L'avenir : EIS de batterie intelligente intégrée
La prochaine frontière en mesurant la fréquence de la batterie s'éloigne de l'équipement de laboratoire externe et se tourne vers l'EIS intégré. Nous intégrons ces capacités de diagnostic directement dans le Système de Gestion de Batterie (BMS). Cela permet :
- une surveillance en temps réel de la dégradation sans mettre le système hors ligne.
- Signes d'alerte précoces d'interruptions internes ou de croissance de dendrites avant qu'ils ne deviennent des dangers pour la sécurité.
- Amélioration de l'estimation du SoC (État de Charge) en mettant à jour constamment le modèle d’impédance de la batterie.
En combinant la mesure de fréquence avec des tests de diagnostic traditionnels, nous créons un profil robuste de la performance de la batterie que les vérifications de tension standard ne peuvent tout simplement pas égaler.