How to Tell if a Vacuum Battery Is Bad Van4NU Guide
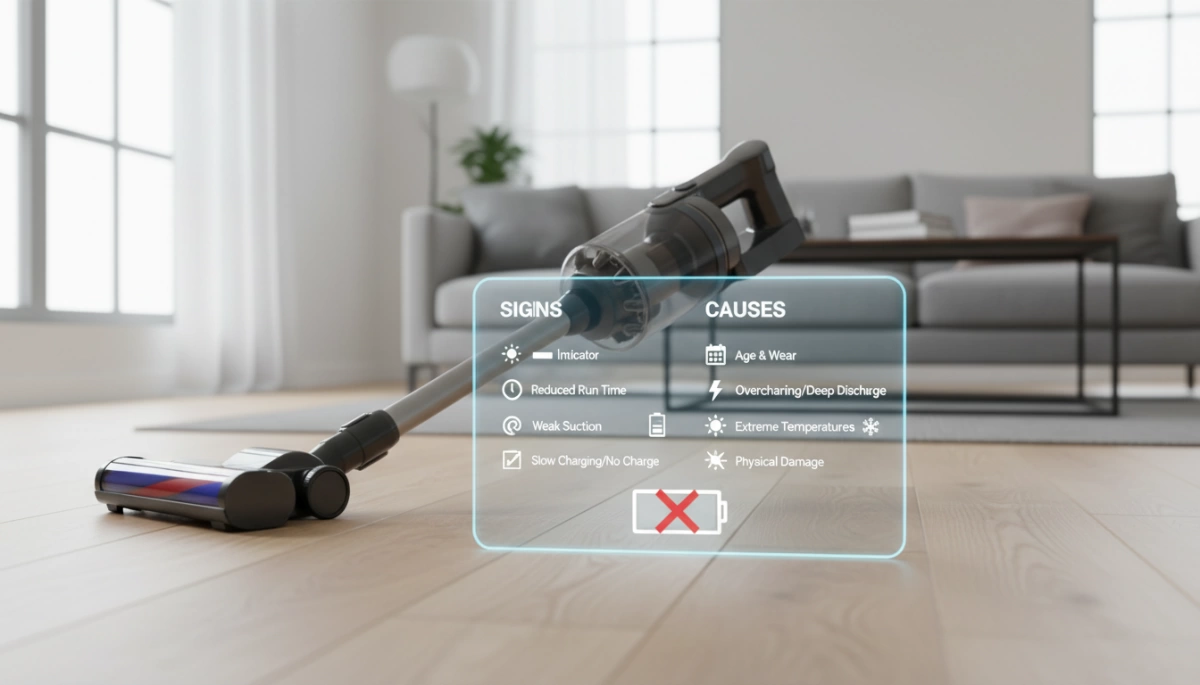
The 5 Most Common Symptoms of a Dead Vacuum Battery
When your cordless vacuum starts acting up, it is usually the power source, not the motor, that is to blame. As manufacturers of high-performance lithium battery packs, we know exactly how lithium-ion battery degradation manifests in daily use. Before you scrap the entire machine, check for these five critical signs that your battery pack has reached the end of its lifecycle.
Drastically Reduced Runtime vs. Normal Degradation
All batteries lose capacity over time, but a healthy lithium pack should last for years with only a gradual decrease in performance. If your vacuum runtime drops significantly—for example, going from 30 minutes of cleaning time to just 5 minutes overnight—this is a clear indicator of cell failure.
- Normal Wear: Losing 1-2 minutes of runtime per year.
- Critical Failure: The vacuum dies halfway through a single room.
The “Cut-Out” Under Load (Voltage Sag)
Does your vacuum shut off immediately when you switch to “Turbo” mode or transition from hard floors to thick carpet? This is known as voltage sag under load.
- Vacuum motors require high discharge current.
- Weak 18650 cells cannot sustain the voltage required for high power.
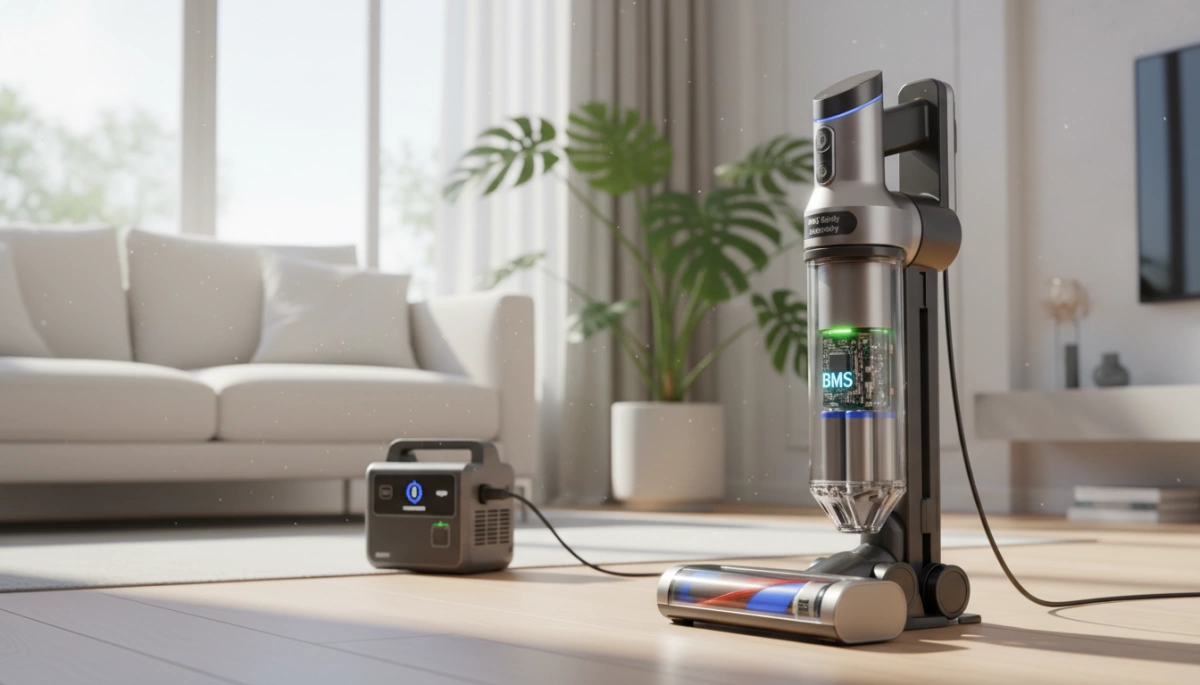
- The internal Battery Management System (BMS) detects the voltage drop and cuts power instantly to protect the device, even if the battery indicator shows a charge.
Refusal to Charge or Light Indicators
If you plug in your device and the charging light flashes red or doesn’t turn on at all, the battery may have suffered deep discharge damage.
- Lithium batteries have a low self-discharge rate (<3% per month), but if left uncharged for months, the voltage can drop below the safety threshold.
- Once voltage hits this critical low, the charger’s safety circuit will refuse to send current to the pack to prevent fire risks.
Rapid Charging Anomalies (False 100%)
A healthy battery takes time to absorb energy. If your vacuum claims to be fully charged after only 10 or 15 minutes on the dock, you are seeing a “false full” reading.
- The Reality: The internal resistance of the battery has spiked.
- The Result: The charger thinks the battery is full because voltage rises too fast, but the actual capacity is near zero.
Physical Deformation (Swelling and Heat)
This is the most dangerous symptom. If the battery case looks warped, cracked, or is difficult to remove from the vacuum slot, you likely have a swollen battery pack.
- Heat Warning: While our packs are rated to handle up to 50°C-60°C, a battery that becomes too hot to touch during standard use is failing.
- Immediate Action: Stop using any swollen battery immediately. This indicates internal chemical decomposition and poses a safety hazard.
Rule It Out: Is It the Battery or the Charger?
Before assuming the lithium cells have failed, you need to verify that the charging system is actually delivering power. In my experience manufacturing battery packs, many “dead” batteries are simply healthy units that haven’t received a proper charge due to external equipment failures.
Check the Outlet and Power Source
Start with the simplest variable. Plug a lamp or phone charger into the same outlet used for the vacuum. If that device doesn’t work, the issue lies with your home’s circuit breaker or the socket itself, not the vacuum. If you use a power strip or surge protector, bypass it and plug the charger directly into the wall to eliminate faulty extension cords.
Inspect the Charging Dock and Cables
Physical damage to the charging infrastructure often mimics battery failure.
- Frayed Wires: Examine the cord for cuts, exposed copper, or severe kinks, especially near the connector.
- Bent Pins: Check the barrel plug or the pins inside the charging dock. If they are bent or loose, the connection will be intermittent.
- Indicator Lights: If the charger has an LED status light, ensure it illuminates when plugged in. No light usually indicates a blown adapter.
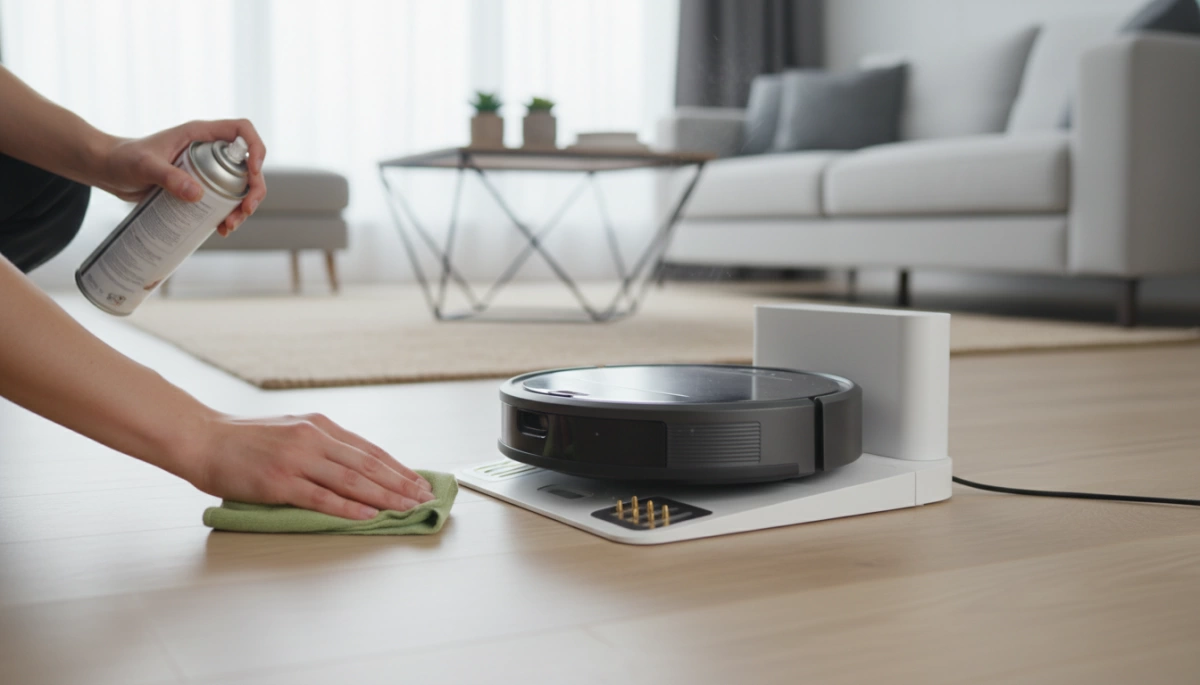
Clean the Metal Contacts
Dust and debris are inevitable with vacuum cleaners, and they frequently interrupt the connection between the charging dock contacts and the vacuum unit. A layer of grime creates resistance, preventing the current from reaching the pack.
- Identify Buildup: Look for dullness, dust cakes, or dark oxidation spots on the metal plates.
- Wipe Down: Use a clean, dry cloth or a cotton swab with a small amount of isopropyl alcohol to clean the contact points on both the dock and the vacuum.
- Regular Upkeep: Proper maintenance and cleaning of battery terminals ensures the Battery Management System (BMS) can accurately detect voltage and charge the cells safely.
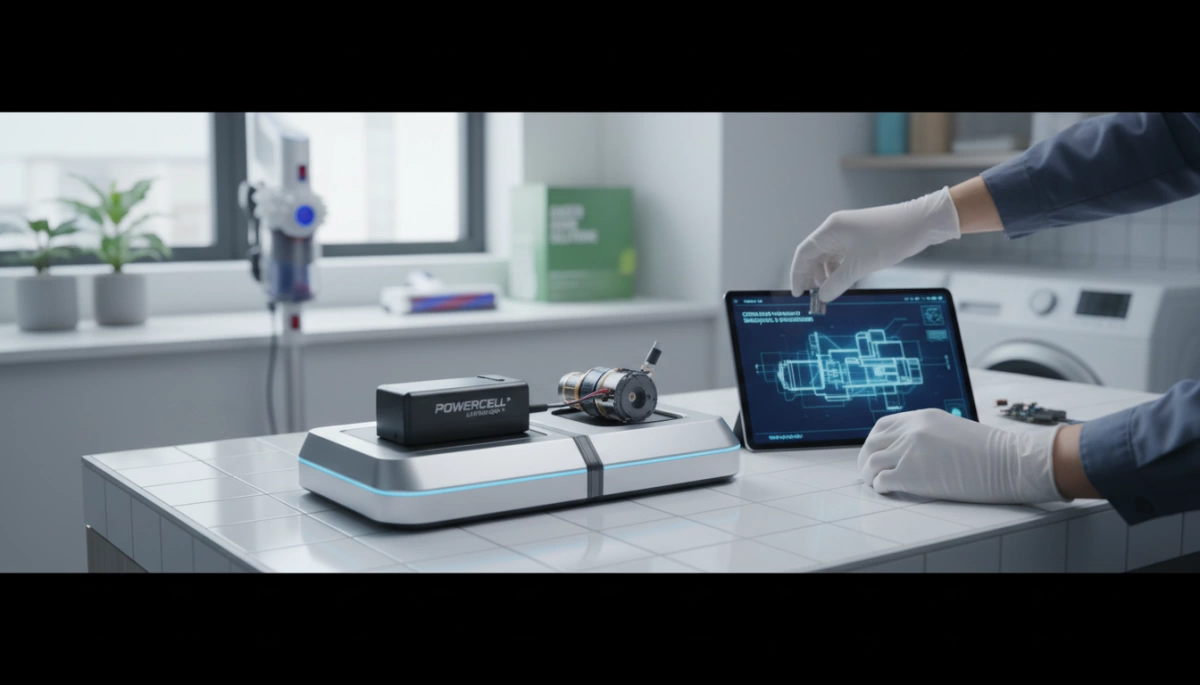
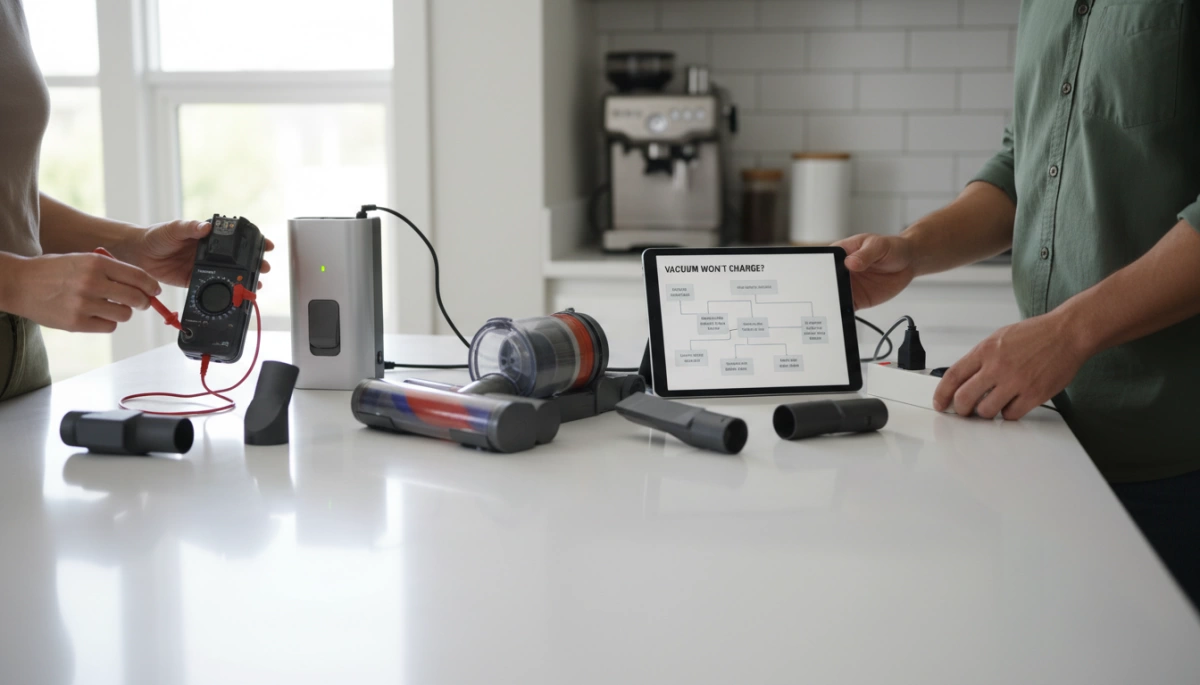
Advanced Diagnostics: How to Test a Vacuum Battery with a Multimeter
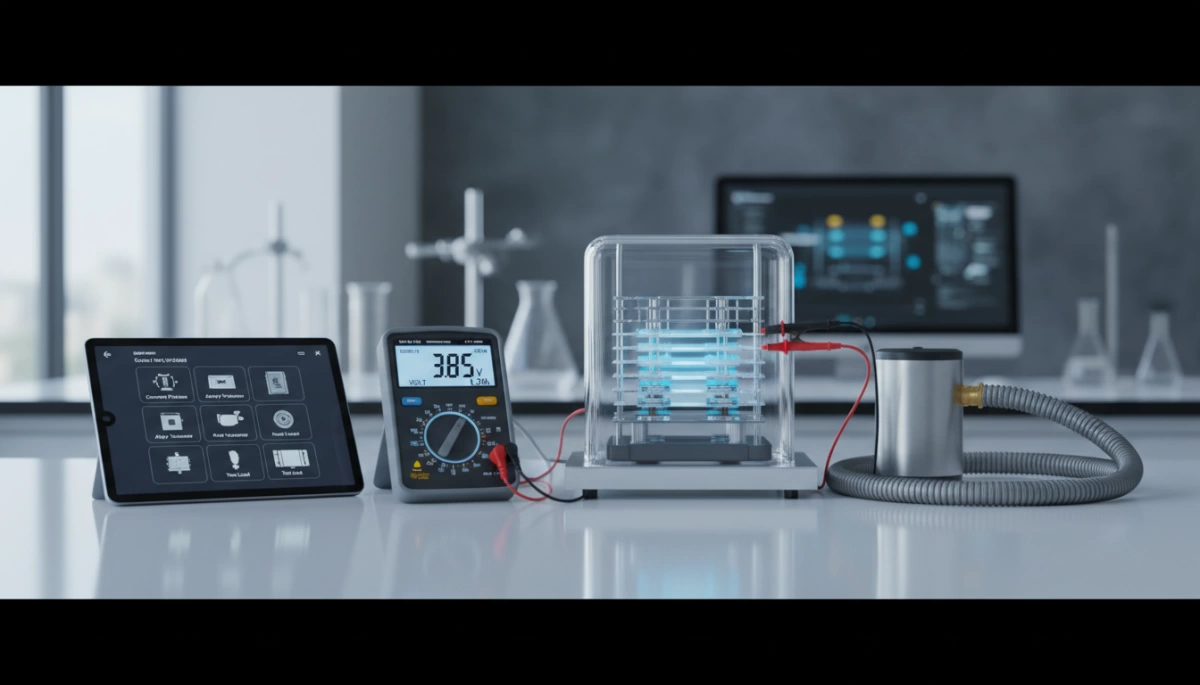
If visual inspection and cleaning contacts didn’t solve the issue, it is time to look at the numbers. A multimeter voltage test provides a definitive answer on whether your battery pack is holding a charge or if the cells have degraded beyond repair.
Safety First: Handling Lithium Batteries
Before probing any terminals, understand that lithium-ion batteries pack a significant punch. Unlike standard AA batteries, the high-discharge cells found in vacuums can deliver high current.
- Never short the terminals: Touching the positive and negative probes together while connected to the battery can cause sparks, heat, or fire.
- Inspect for damage: Do not test a battery that is swollen, leaking, or physically cracked.
- Use the right setting: Ensure your multimeter is set to DC Voltage (usually denoted by a V with a straight line).
Step 1: Measuring DC Voltage
This static test checks the resting voltage of the pack. To get an accurate reading, charge the vacuum for at least 4-6 hours before testing.
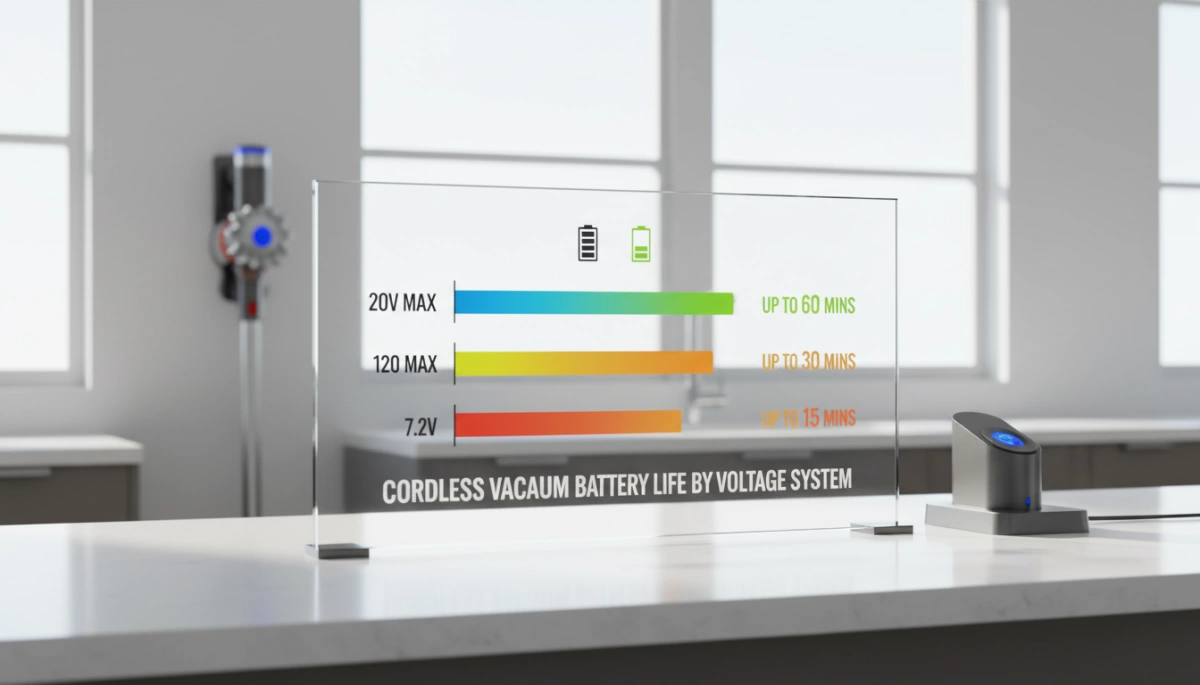
- Locate the Voltage Rating: Check the sticker on your battery pack for its nominal voltage (e.g., 18V, 21.6V, or 25.2V).
- Probe the Terminals: Place the red probe on the positive (+) terminal and the black probe on the negative (-) terminal.
- Analyze the Reading: A healthy fully charged battery should read slightly higher than its nominal voltage. For example, a 18V pack should read around 20V-21V when full.
- Good: Voltage is at or slightly above the rating.
- Bad: Voltage is significantly below the rating (e.g., an 18V battery reading 15V). This indicates a dead cell or deep discharge damage that the charger cannot overcome.
If the reading is near zero, the BMS may have shut down the pack for safety, or the cells have completely failed. In some cases, understanding how to bring a 18650 battery back to life can help you attempt a revival, but for sealed vacuum packs, this usually confirms a replacement is needed.
Step 2: The Load Test (Simplified)
A battery can sometimes show a “ghost voltage” (surface charge) that looks normal but collapses the moment the vacuum tries to pull power. This explains why a vacuum might show a green light but die the second you pull the trigger.
- Connect the Multimeter: Secure the probes to the battery terminals (using alligator clips helps).
- Turn on the Vacuum: Watch the multimeter screen closely as you switch the device on.
- Watch for Voltage Sag: It is normal for voltage to drop slightly under load. However, if the voltage plummets immediately (e.g., drops from 20V to 12V instantly), the battery has high internal resistance and is effectively dead.
This “voltage sag under load” is the most accurate indicator that the lithium chemistry is worn out and can no longer sustain the high-drain requirements of a vacuum motor.
Why Do Lithium-Ion Vacuum Batteries Fail?
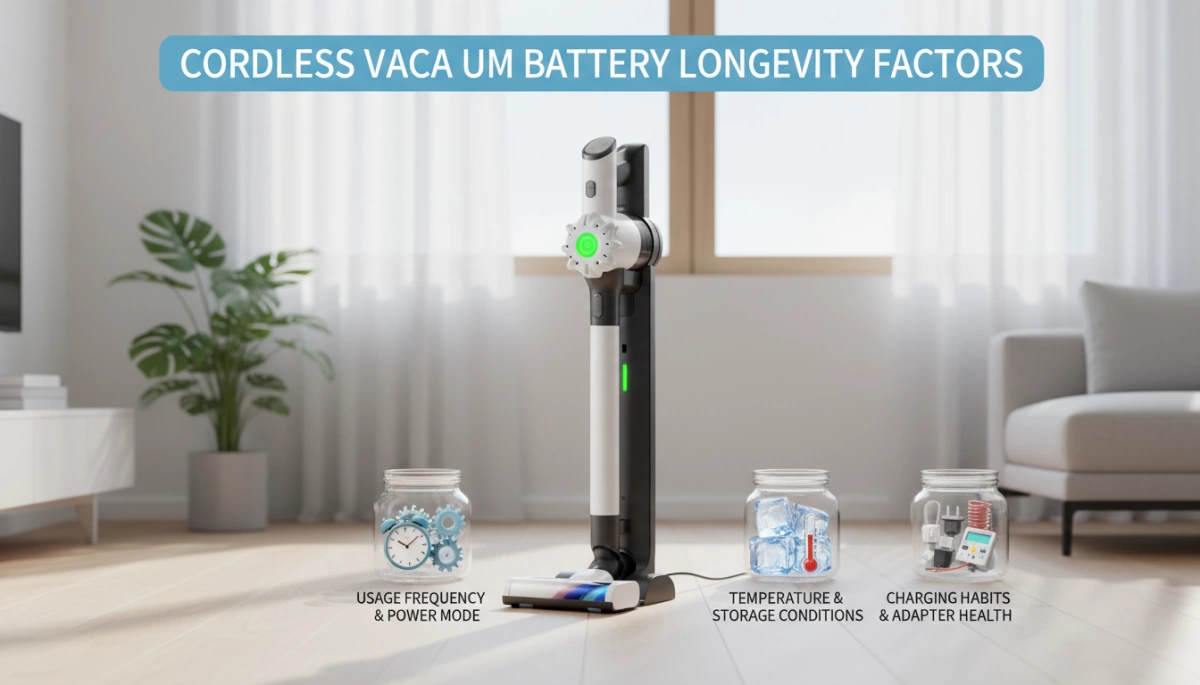
Vacuum batteries don’t just die overnight; they usually fail due to a combination of chemical aging and user habits. Understanding the science behind lithium-ion battery degradation helps us pinpoint why a once-powerful vacuum now struggles to clean a single room.
Understanding Cycle Life (300-500 Cycles)
Every battery has a finite lifespan measured in charge cycles. For many standard consumer-grade vacuum batteries, you can expect noticeable capacity loss after about 300 to 500 full charge-discharge cycles. While our industrial-grade lithium solutions are engineered for 2000-5000+ cycles, the generic packs found in many home appliances often degrade much faster. Once you hit that cycle limit, the internal chemistry can no longer hold energy effectively, leading to vacuum runtime drops that leave you frustrated.
Heat Damage and Clogged Filters
Heat is the number one enemy of lithium cells. In vacuums, heat buildup often isn’t the battery’s fault initially—it starts with the filters. When filters are clogged with dust, the vacuum motor has to work harder to create suction. This increased load draws more current from the battery, causing the pack to overheat. Consistently running a battery at high temperatures (above 50°C/122°F) accelerates chemical breakdown and can lead to 18650 cell failure or even swelling.
Storage Mistakes and Deep Discharge
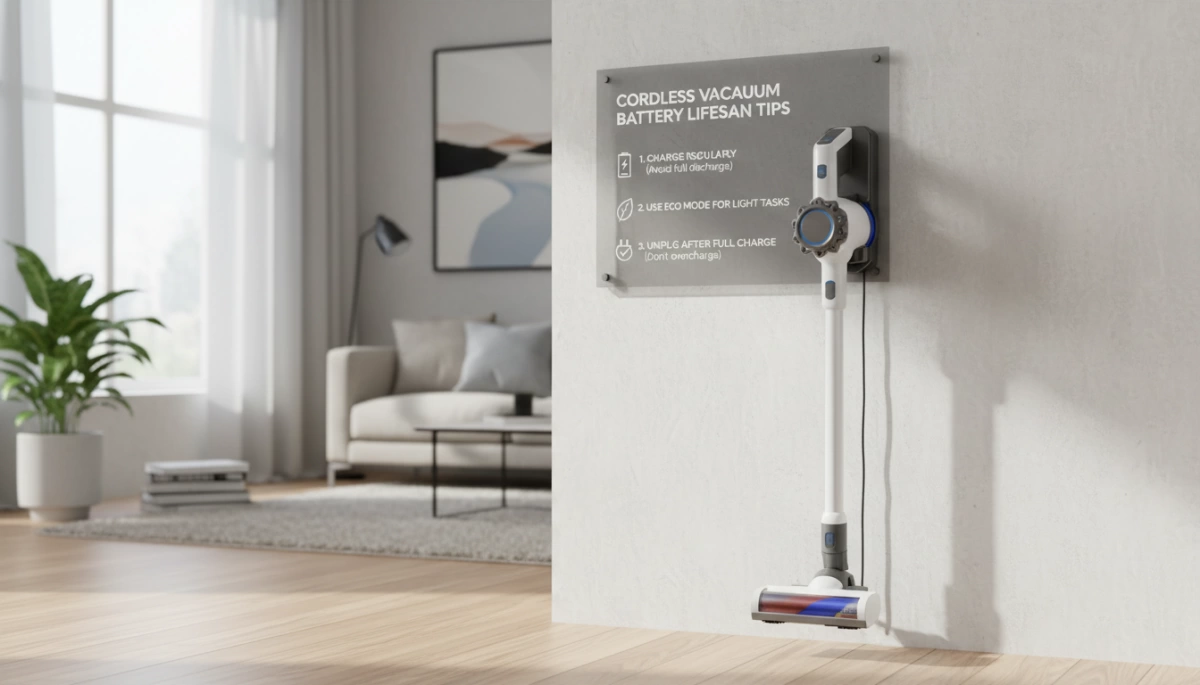
How you store your vacuum matters just as much as how you use it. One of the most common causes of failure is deep discharge damage. If a vacuum is left uncharged for months, the battery’s voltage can drop below a critical safety threshold due to natural self-discharge.
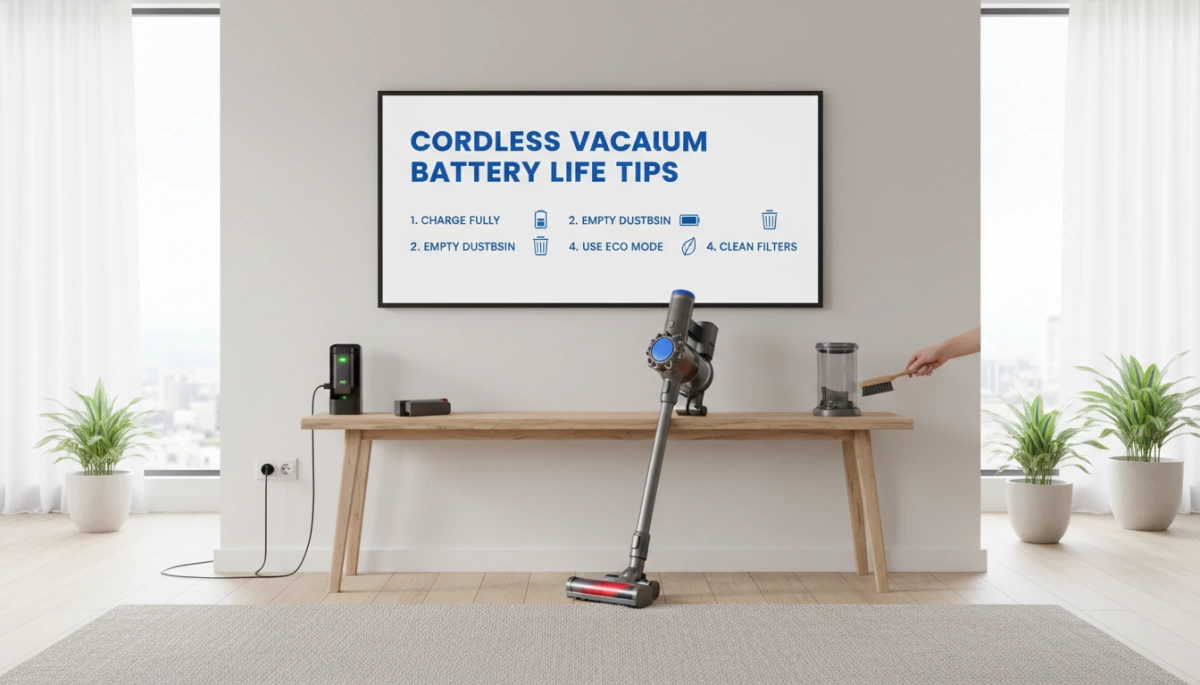
- The Rule: We recommend charging your battery at least twice a month if it’s not in regular use.
- The Risk: Once voltage drops too low, the Battery Management System (BMS) may permanently lock the battery to prevent safety hazards, rendering it useless.
Understanding the differences in battery chemistry can also help you maintain them better; for instance, knowing the nuances of lithium-ion vs LiPo battery technology can guide proper storage and charging habits to extend vacuum battery life expectancy.
The Nuranu Difference: When to Replace and What to Look For
When you decide it is time to swap out a failing power source, choosing the right replacement vacuum battery pack is critical. You aren’t just buying a plastic box with cells inside; you are investing in the engine that drives your appliance. At Nuranu, we manufacture lithium solutions designed to solve the specific power failures common in generic or aging batteries.
The Importance of BMS (Battery Management Systems)
A battery is only as good as its brain. Every Nuranu lithium pack is equipped with a proprietary Battery Management System (BMS). This internal circuit is the first line of defense against failure. It constantly monitors voltage and temperature to prevent the deep discharge damage that kills standard batteries.
Without a quality BMS, a battery can easily overcharge or discharge too rapidly, leading to permanent capacity loss. Our BMS ensures that your vacuum stops drawing power before the cells reach a critical low voltage, effectively preserving the battery’s health for years rather than months. If you want to learn more about extending battery cycle life, understanding the role of the BMS is the first step.
Safety Certifications (UN38.3 and UL)
Safety is not a feature; it is a requirement. Cheap, uncertified batteries are a fire risk, especially when subjected to the heat and vibration of a vacuum cleaner. We adhere to strict global standards to ensure reliability.
- UN38.3: Ensures the battery is safe for transport and withstands vibration and shock.
- UL Certification: Verifies that the pack meets rigorous safety standards for consumer use.
- CE Marking: Confirms conformity with health, safety, and environmental protection standards.
We prioritize these certifications so you can trust the pack in your home. For example, understanding if specific battery chemistries are safe is part of our commitment to transparent manufacturing.
High-Drain Capability for Turbo Modes
Vacuum cleaners are unique because they require massive bursts of energy, especially when you hit the “Turbo” or “Max” switch. Standard batteries often suffer from voltage sag under this load, causing the vacuum to cut out even if the battery isn’t empty.
Nuranu utilizes high-drain battery cells specifically engineered to handle high discharge currents. This means our packs can deliver the intense power needed for maximum suction without triggering a false “empty” signal.
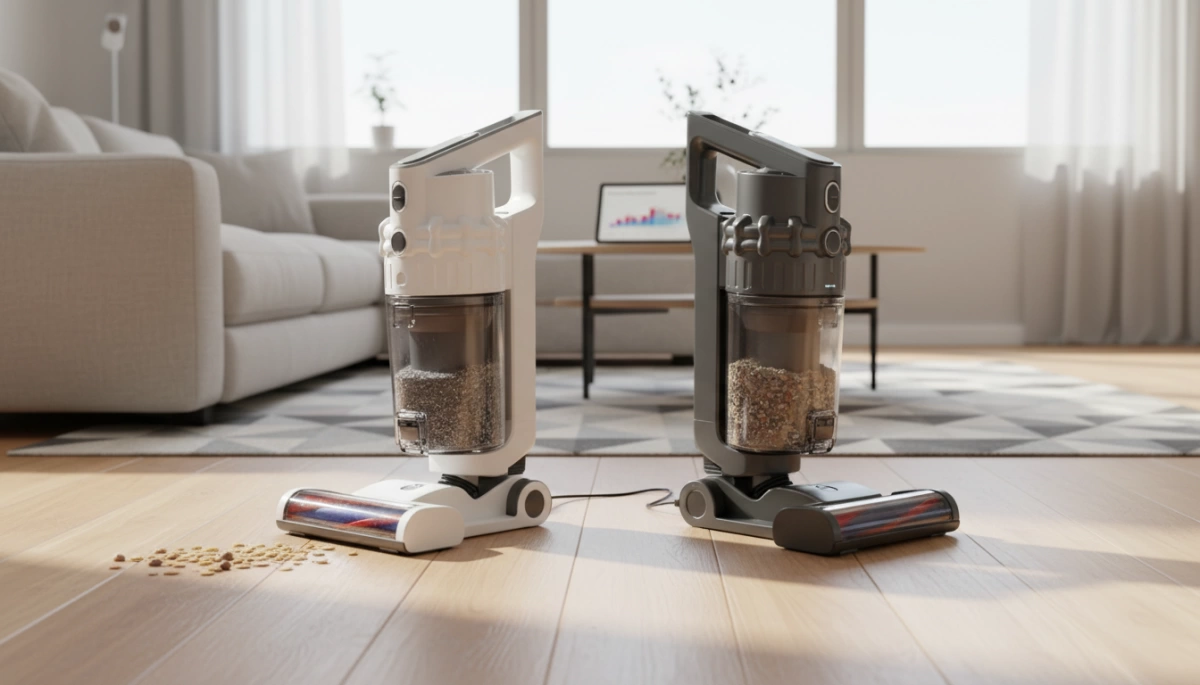
Comparison: Generic vs. Nuranu Replacement
| Feature | Generic Replacement | Nuranu Lithium Solution |
|---|---|---|
| Discharge Current | Low (Causes cut-outs on Max mode) | High (Supports Turbo/Max modes) |
| Protection | Basic or Non-existent | Advanced BMS (Overcharge/Temp protection) |
| Weight | Heavy (Lead-acid/NiMH) | Lightweight (Lithium-Ion/LiFePO4) |
| Lifespan | 300-500 Cycles | 2000-5000+ Cycles |
| Memory Effect | Yes (Must fully drain) | No (Charge anytime) |
FAQ: Common Questions About Vacuum Battery Health
Can I leave my cordless vacuum on the charger all the time?
For most modern devices using Lithium-Ion technology, leaving the vacuum on the dock is safe. Our battery packs are equipped with a Battery Management System (BMS) that prevents overcharging by cutting off the current once the cells reach capacity. However, if you plan to store the vacuum for an extended period without use, do not leave the battery empty. To avoid deep discharge failure—where the battery refuses to wake up—we recommend charging the unit at least twice a month. You can read more about how maintenance habits affect performance in our guide on common problems with cordless vacuums.
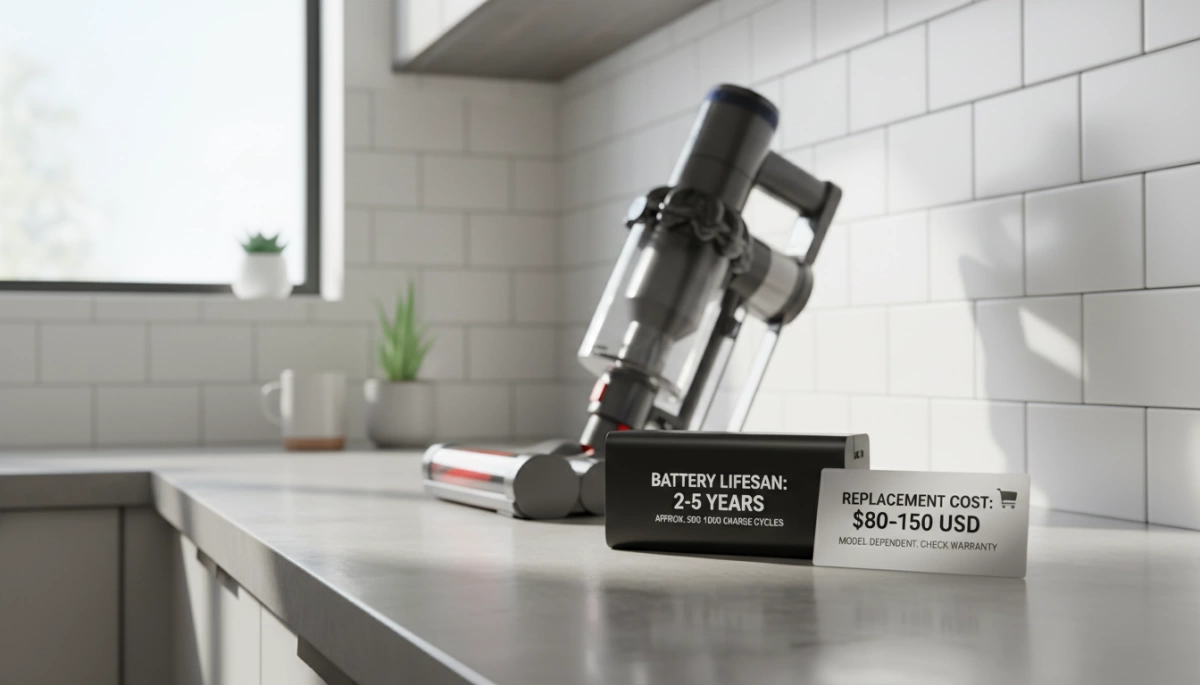
How many years should a vacuum battery last?
Vacuum battery life expectancy varies significantly based on the chemistry inside the pack. Older lead-acid or NiMH batteries typically last for 300 to 500 charge cycles before they degrade. In contrast, Nuranu Lithium-Ion solutions are engineered for longevity, offering between 2000 and 5000+ cycles. In a standard US household, this translates to years of consistent service before you experience noticeable runtime drops.
Is it worth replacing the battery or should I buy a new vacuum?
Replacing the battery is almost always the more cost-effective choice. High-quality cordless vacuums are expensive machines, and often the motor and filtration systems outlive the original power pack. Buying a replacement vacuum battery pack restores your device to full power for a fraction of the price of a new appliance. Since our lithium replacements are lighter and have zero memory effect compared to older battery types, a replacement often acts as a performance upgrade rather than just a repair.