Group 24 Lithium Battery Guide by Professional Manufacturer
Group 24 Battery Dimensions and Physical Specs
When you are looking to replace an old power cell, the first question is always: “Will it fit my battery tray?” The BCI Group 24 size is one of the most common standards used in the United States for marine, RV, and solar applications. We find that sticking to these precise measurements ensures a “drop-in” replacement without needing to modify your mounting hardware.
BCI Group 24 Specifications
- Length: 10.25 inches (260 mm)
- Width: 6.81 inches (173 mm)
- Height: 8.875 inches (225 mm)
Terminal Types and Configurations
The Group 24 standard isn’t just about the box size; the terminal layout matters for your cable reach.
- Top-Post: The most common configuration for standard automotive and deep-cycle needs.
- Dual Terminals: Frequently found in marine batteries, offering both threaded posts for electronics and traditional round posts for engine cranking.
- 24F vs. 24R: Pay attention to the “F” or “R” designations, which indicate reversed polarity. We recommend double-checking your cable orientation before selecting a specific model to avoid short circuits.
Capacity and Performance Metrics
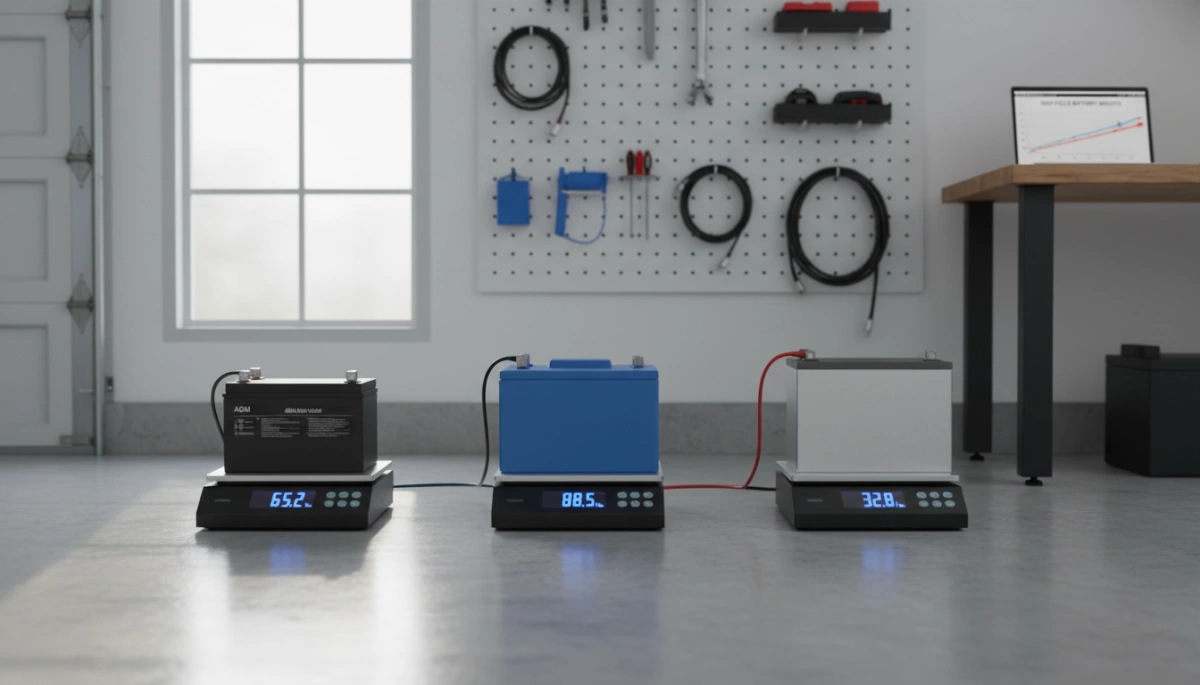
There is a massive difference in energy density when comparing traditional tech to modern lithium upgrades. While a lead-acid Group 24 battery typically offers 70-85 Ah, our LiFePO4 Group 24 replacements often deliver a full 100 Ah of capacity in the exact same footprint.
| Metric | Lead-Acid Group 24 | Lithium LiFePO4 Group 24 |
|---|---|---|
| Typical Capacity | 70-85 Ah | 100 Ah |
| Usable Capacity | ~50% (35-42 Ah) | 100% (100 Ah) |
| Cold Cranking Amps (CCA) | 500-800 | High Peak Discharge |
| Reserve Capacity (RC) | ~100-140 mins | Consistent Voltage Output |
Key Performance Ratings
- Cold Cranking Amps (CCA): Critical for starting engines in cold weather.
- Marine Cranking Amps (MCA): Similar to CCA but measured at 32°F, specific to boating needs.
- Reserve Capacity: This measures how many minutes the battery can run a 25-amp load before the voltage drops too low. With lithium, the stable voltage curve means you get a much more reliable discharge rate compared to the steady decline of lead-acid.
Common Battery Types in the BCI Group 24 Size
When you’re looking for a Group 24 battery, you’ll run into four main chemistries. Each has its place depending on your budget and how hard you plan to run your equipment. While the Group 24 battery dimensions stay the same, the tech inside changes everything.
Flooded Lead-Acid (FLA)
This is the old-school choice. It’s the most affordable upfront but comes with a “tax” on your time.
- Pros: Cheapest entry price; widely available.
- Cons: Requires regular water top-offs; prone to leaking acid; heavy.
- Maintenance: You have to check fluid levels monthly. Neglecting this is why most fail early, so understanding how often to replace your car battery becomes critical if you stick with lead-acid.
AGM (Absorbent Glass Mat)
A Group 24 AGM battery is a major step up for most boaters and RVers.
- Maintenance-Free: Completely sealed, so no spilling or gassing.
- Vibration Resistant: Built tough for bumpy roads or choppy water.
- Performance: Better at handling high-current draws than standard flooded cells.
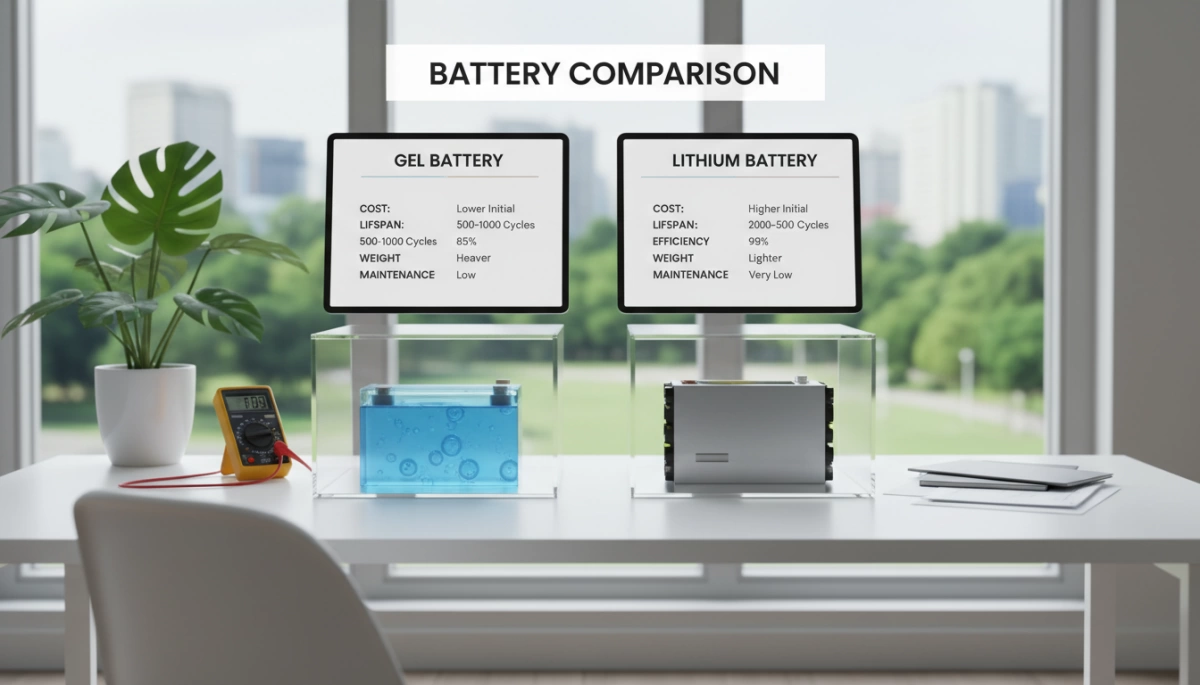
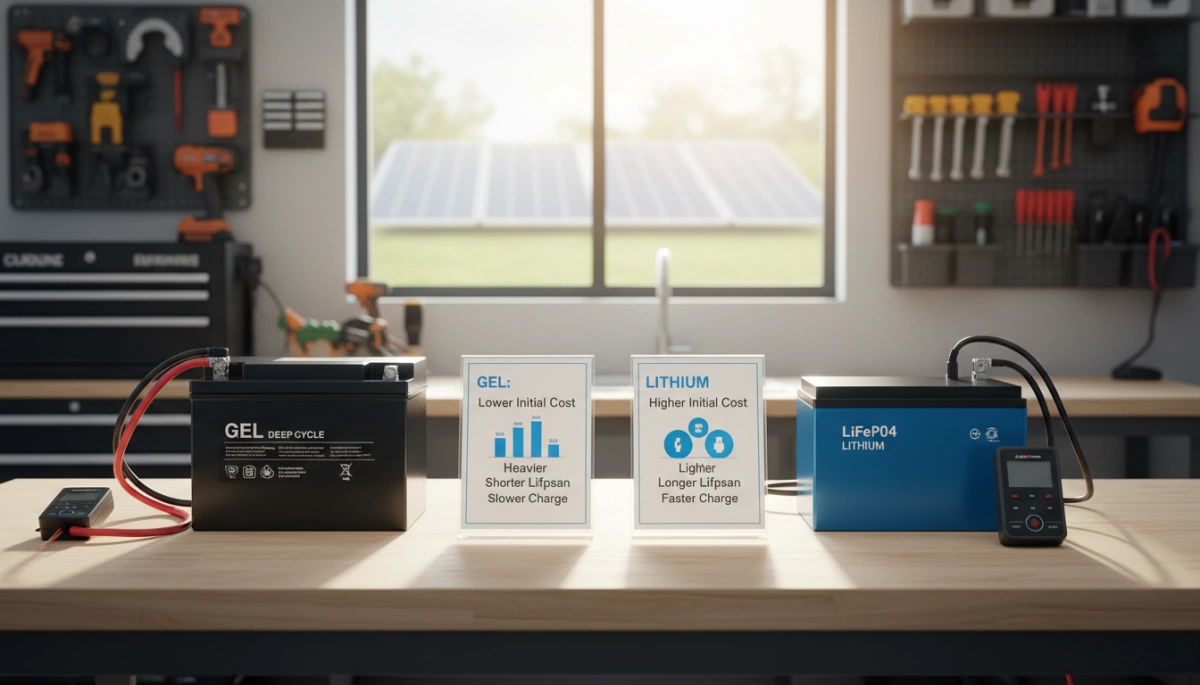
Gel-Cell Batteries
Gel batteries use a thickened electrolyte. They are often confused with AGM but are specifically designed for deep-cycle applications.
- Best For: Low-power, long-duration discharge.
- Sensitivity: They require specific charging profiles. If you use a standard charger, you’ll cook the gel and ruin the battery quickly.
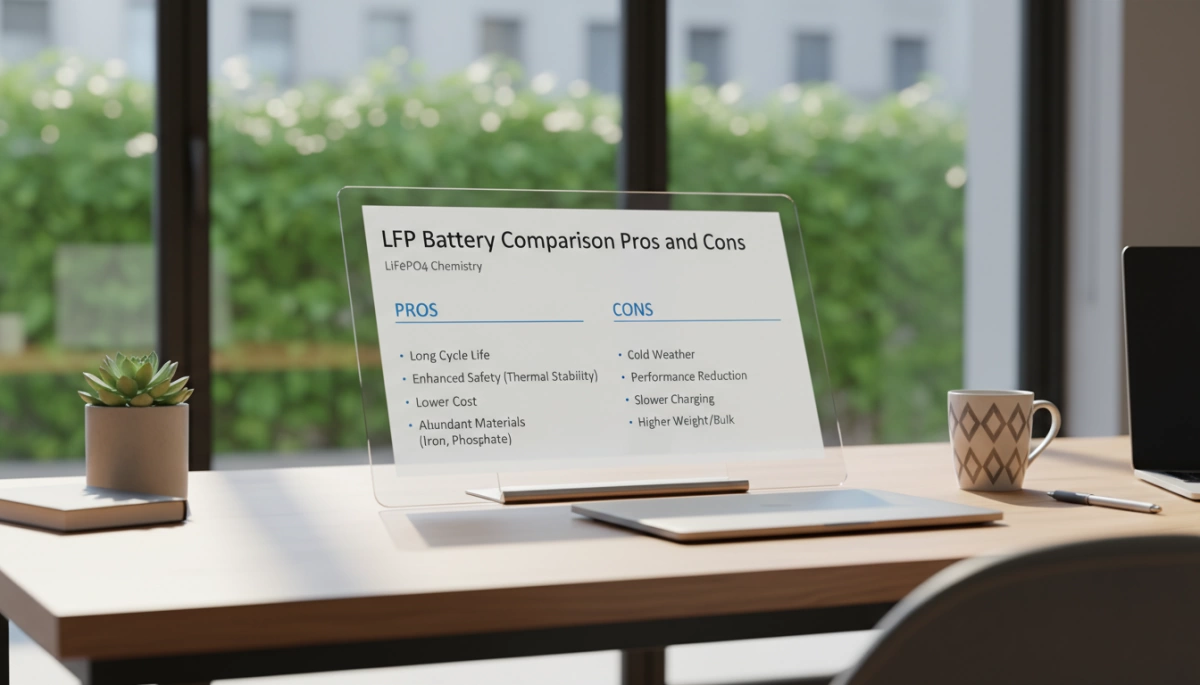
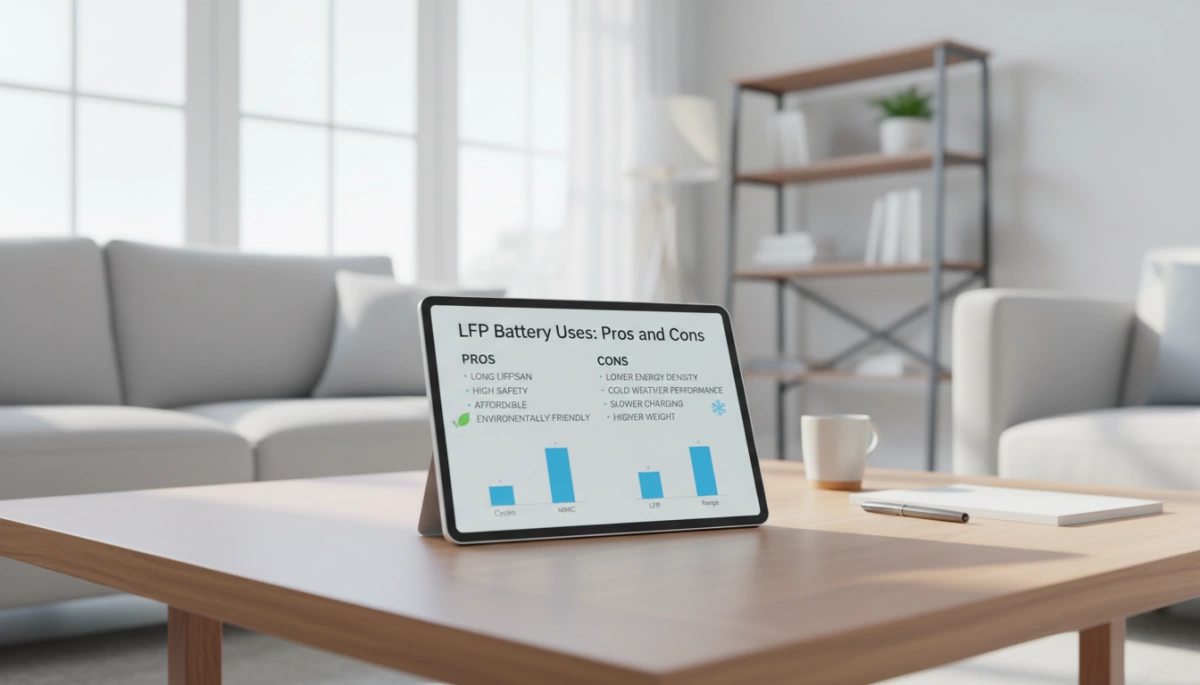
Lithium LiFePO4: The Modern High-Performance Upgrade
The Group 24 LiFePO4 battery is the gold standard for anyone serious about power. It’s the smartest investment for long-term savings.
- Efficiency: You get nearly double the usable energy compared to lead-acid.
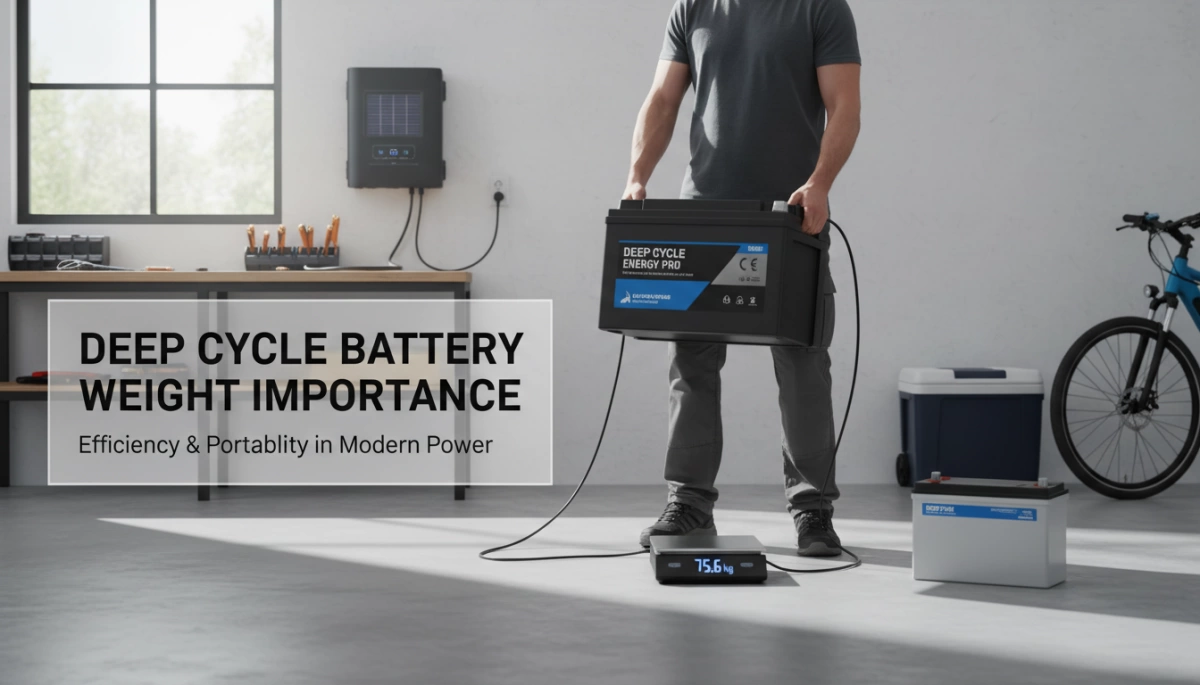
- Weight: About half the weight, making it a favorite for Trolling motor battery Group 24 setups.
- Safety: We use stable chemistry that won’t catch fire. If you’re curious about the tech, learning what is 32650 lifepo4 battery and is it safe gives you a good idea of why this chemistry is so reliable for our Group 24 builds.
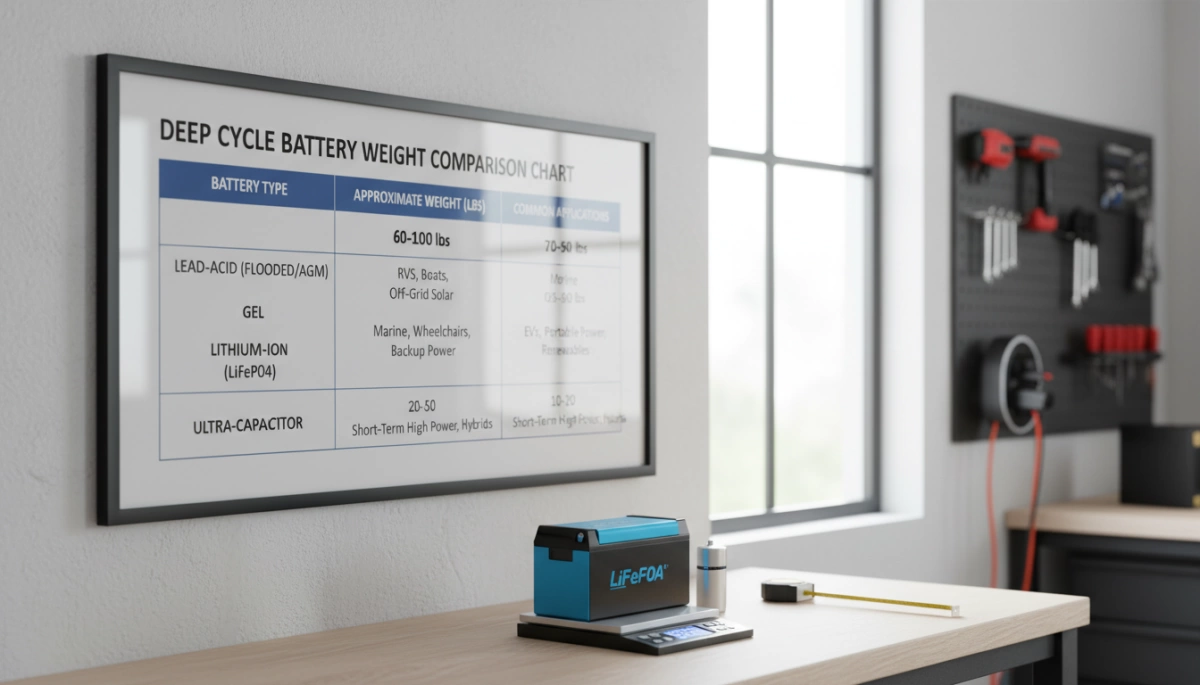
| Battery Type | Lifespan (Cycles) | Maintenance | Weight |
|---|---|---|---|
| Flooded | 300 – 500 | High | Heavy |
| AGM | 500 – 800 | None | Heavy |
| Gel | 500 – 1,000 | None | Heavy |
| Lithium (LiFePO4) | 3,000 – 5,000+ | None | Ultra-Light |
Why Upgrade to a Lithium Group 24 Battery – Professional Lithium Battery Manufacturer Vendor Insights
Switching to a Group 24 LiFePO4 battery is the most effective way to modernize your power system. As a dedicated manufacturer, we focus on replacing heavy, inefficient lead-acid blocks with high-performance lithium technology that delivers more power with less hassle. A lithium upgrade Group 24 isn’t just a minor improvement; it is a total overhaul of your energy capabilities.
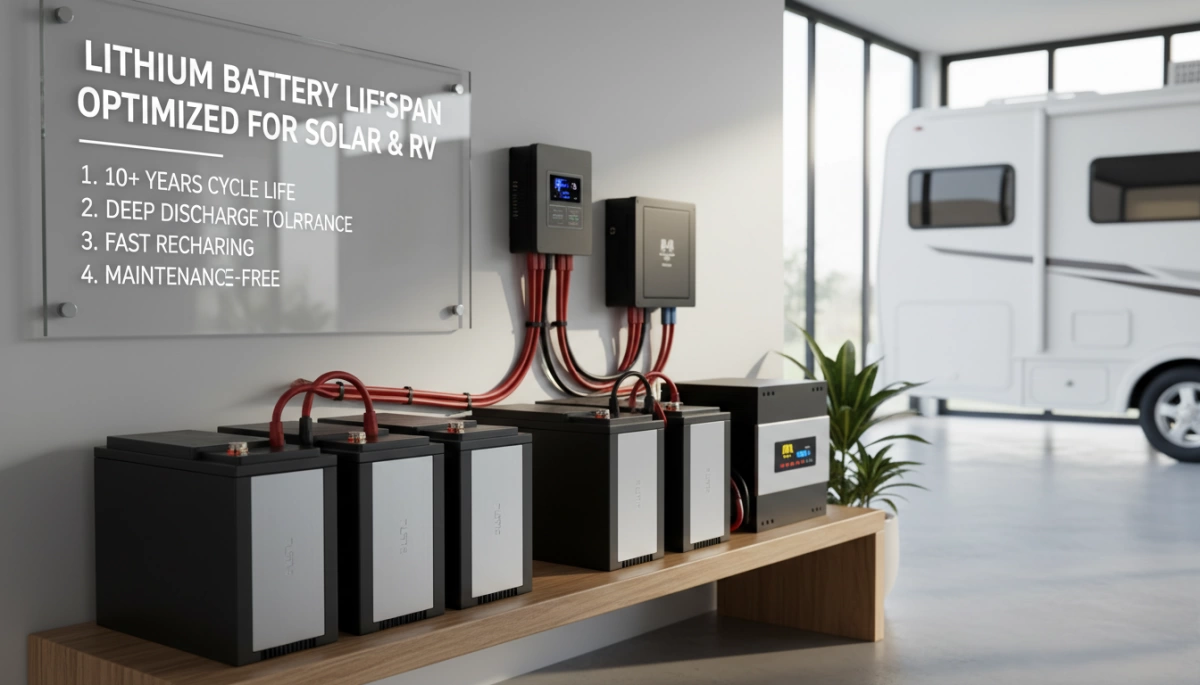
Superior Performance and Efficiency
The technical advantages of moving to lithium are immediate and impactful for any high-demand application.
- Massive Weight Savings: Our batteries are approximately 1/3 the weight of lead-acid equivalents. This 70% weight reduction improves fuel efficiency in RVs and increases speed in marine applications.
- Extreme Longevity: We build our batteries to last between 4,000 and 6,000+ deep cycles. Compared to the few hundred cycles you get from lead-acid, this provides a reliable 10-year service life.
- 100% Usable Capacity: You can safely use the entire capacity of a lightweight deep cycle battery without damage. Lead-acid batteries are typically limited to 50% depth of discharge, meaning a lithium battery provides twice the runtime in the same BCI size.
Advanced Safety and Maintenance-Free Design
Our units are designed for “set it and forget it” operation. Every battery features an integrated Smart BMS lithium battery management system. This internal controller monitors the health of the Grade A cells, preventing overcharging, over-discharging, and thermal issues. To understand why this internal brain is so critical, you can see how even smaller cells require similar logic by checking do 18650 batteries have protection to ensure long-term stability.
- Fast Charging: Lithium chemistry accepts a charge much faster than traditional batteries, significantly reducing your downtime.
- Stable Voltage: Unlike lead-acid, where voltage drops as the battery drains, lithium maintains a steady output. This ensures your trolling motors and electronics run at full strength until the battery is nearly empty.
- Eco-Friendly & Maintenance-Free: There is no acid to spill, no toxic fumes, and absolutely no need for water refilling. It is a clean, sealed solution for harsh environments.
By choosing a professional vendor for your Group 24 needs, you ensure that you receive a battery optimized for high energy density and maximum safety standards.
Choosing a Professional Lithium Battery Manufacturer Vendor for Group 24
When you are looking for a Group 24 LiFePO4 battery, the vendor you choose determines the safety and longevity of your power system. As a professional manufacturer, we focus on high-performance standards that go beyond the basic retail shelf options. We prioritize industrial-grade components to ensure every unit delivers “worry-free” power for years.
- Grade A LiFePO4 Cells: We use only brand-new, Grade A cells to ensure maximum stability and energy density. This is the foundation of a battery that lasts 10+ years.
- Integrated Smart BMS: Our batteries feature a built-in Smart BMS lithium battery management system. This “brain” monitors everything—protecting against overcharge, over-discharge, short circuits, and thermal issues.
- Rugged Environmental Protection: Our Group 24 builds come with IP65/IP67 waterproof ratings, making them ideal for the heavy spray of marine environments or the dust of off-grid trails.
- Scalability and Flexibility: We design these units for easy scalability. Whether you need to connect in series for higher voltage or parallel for more capacity, our internal architecture supports your custom power needs.
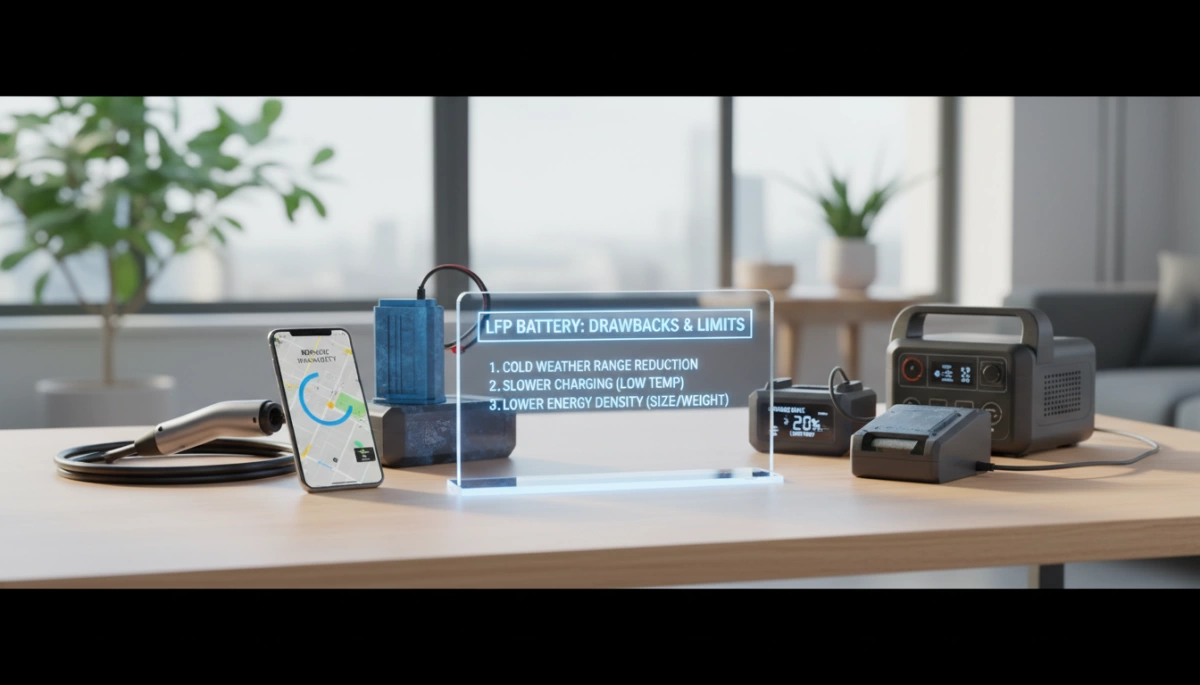
- Extreme Temperature Durability: These batteries are built to handle the heat and the cold. For users in northern climates, following a winter maintenance guide for lithium batteries ensures your Group 24 cells stay healthy even when the temperature drops.
By sourcing directly from a professional manufacturer, you gain access to 4,000 to 6,000+ deep cycles, providing a significantly lower total cost of ownership compared to traditional lead-acid alternatives. We focus on providing high-quality solutions that meet global standards like CE, UN38.3, and MSDS, ensuring your installation is safe, legal, and reliable.
Versatile Applications for a Group 24 LiFePO4 Battery
Our Group 24 LiFePO4 battery is a powerhouse designed to handle demanding American outdoor and industrial environments. Whether you are hitting the lake or living off-grid, this specific size provides a compact footprint with significantly more usable energy than traditional options.
Marine and Boating
As a premier marine Group 24 battery, this unit is the go-to choice for trolling motor battery Group 24 applications. Unlike lead-acid, lithium maintains a steady voltage until it is nearly depleted, meaning your motor won’t lose thrust halfway through the day. It also powers:
- Fish finders and high-end GPS units.
- Onboard LED lighting and bilge pumps.
- Compact radio systems and communication gear.
RV and Off-Grid Camping
For RV enthusiasts, the RV Group 24 battery serves as a reliable house power source. Since many battery trays are built specifically for the Group 24 size, a lithium upgrade Group 24 is a simple drop-in replacement that doubles your runtime. It is the perfect solution for:
- Powering slide-outs and leveling jacks.
- Running vent fans and water pumps.
- Charging laptops and mobile devices via inverters.
Solar Energy and Industrial Backup
In solar setups, the deep-cycle performance of our LiFePO4 cells allows for 100% depth of discharge without damaging the chemistry. This makes it ideal for small solar kits, emergency UPS backups, and industrial mobility equipment like wheelchairs or electric carts. If you are replacing an old unit, understanding how to tell if your battery is dead is the first step toward upgrading to a maintenance-free lithium system.
Real-World Runtime Examples
A standard 12V 100Ah Group 24 lithium battery offers vastly different performance compared to lead-acid. Because you can use the full capacity, the runtimes for typical loads are impressive:
| Typical Load | Average Power Draw | Estimated Runtime (100Ah Lithium) |
|---|---|---|
| LED Lights | 10 Watts | 120 Hours |
| CPAP Machine | 30 Watts | 40 Hours |
| Portable Fridge | 50 Watts | 24+ Hours |
| Trolling Motor | 200 Watts (Variable) | 4-6 Hours of typical use |
Our batteries ensure that whether you are on a remote job site or a weekend fishing trip, your power supply remains consistent and “worry-free.”
Group 24 vs Group 27 and Group 31
When you’re upgrading your power system, size matters just as much as capacity. The BCI Group 24 battery is often the “goldilocks” choice for many RV and boat owners because it fits into standard factory battery boxes while delivering massive, reliable power.
Group 24 vs Group 27: Size vs Capacity
The main difference between these two is the physical footprint.
- Group 24: Measures approximately 10.25″ L x 6.81″ W. It is the industry standard for tight compartments.
- Group 27: Usually about 12″ long, requiring more shelf space.
In the lithium world, we pack a 100Ah 12V LiFePO4 into a Group 24 case. This gives you the same energy density that used to require a much larger and heavier Group 27 lead-acid battery, making the lithium upgrade Group 24 the smarter play for space-saving efficiency.
Group 24 vs Group 31: Heavy-Duty Needs
The Group 31 is the “heavy hitter” of the bunch, being significantly longer and taller. While a Group 31 lead-acid battery is often chosen for high-capacity needs, it comes with a massive weight penalty. Our Group 24 lithium options provide 100% usable capacity (DOD), meaning a single Group 24 LiFePO4 often outperforms a bulky Group 31 lead-acid battery in real-world runtime without the back-breaking weight.
When to Choose Group 24 for Fitment Constraints
You should stick with the Group 24 size if your setup involves:
- Existing Battery Trays: Most factory RV and trolling motor compartments are built specifically for this footprint.
- Weight Sensitivity: Keeping your tongue weight or boat balance in check is easier with a compact, lightweight unit.
- Modular Expansion: It is often easier to fit two Group 24 batteries side-by-side in a custom storage area than to struggle with the dimensions of larger BCI groups.
While we specialize in these standard vehicle sizes, we also manufacture specialized LiFePO4 battery packs for solar LED street lights and other compact applications, ensuring that no matter the “fitment constraint,” we have a high-performance lithium solution ready to go. Choosing the right size ensures a drop-in replacement Group 24 experience that is truly plug-and-play.
Installation and Safety: Everything You Should Know About Group 24 Battery Upgrades
Upgrading to a Group 24 LiFePO4 battery is a seamless process when you follow a few professional standards. As a manufacturer, we design these units to be a true drop-in replacement, meaning they match the footprint of traditional lead-acid batteries while providing significantly better performance.
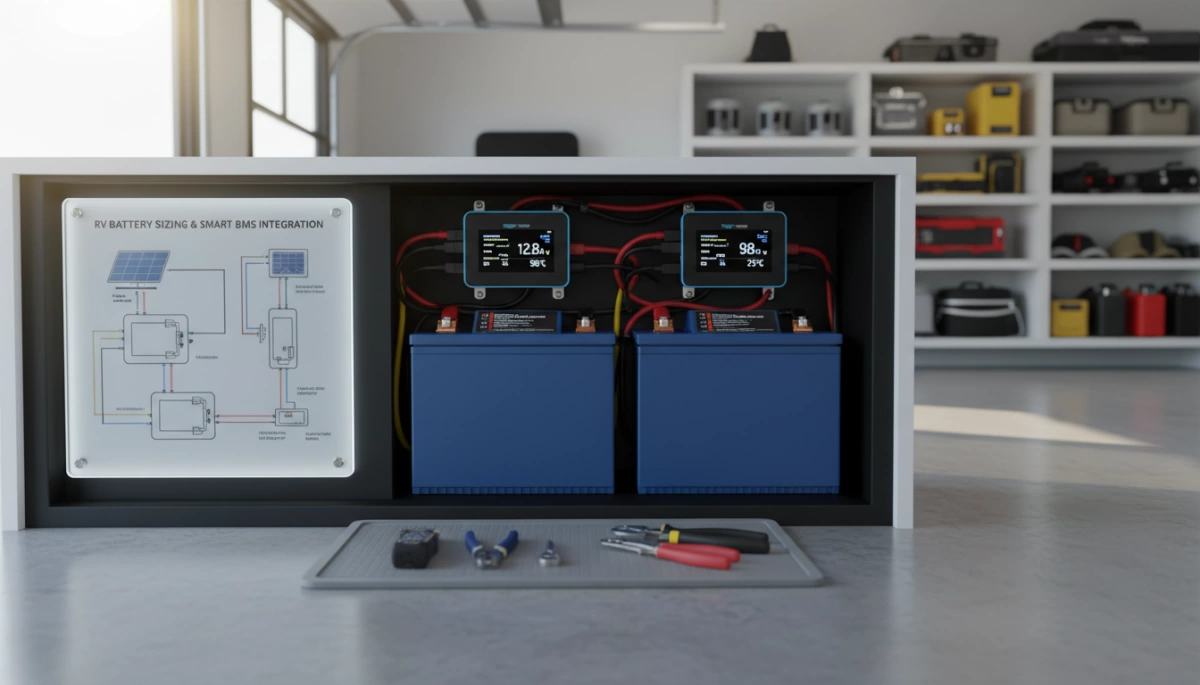
Ensuring a Snug Fit and Proper Wiring
Our Group 24 lithium batteries strictly follow the BCI standard dimensions (approx. 10.25″ x 6.81″ x 8.875″). Because lithium is roughly 1/3 the weight of lead-acid, you must ensure the battery is properly secured with straps or brackets to prevent it from shifting in your RV or boat during transit.
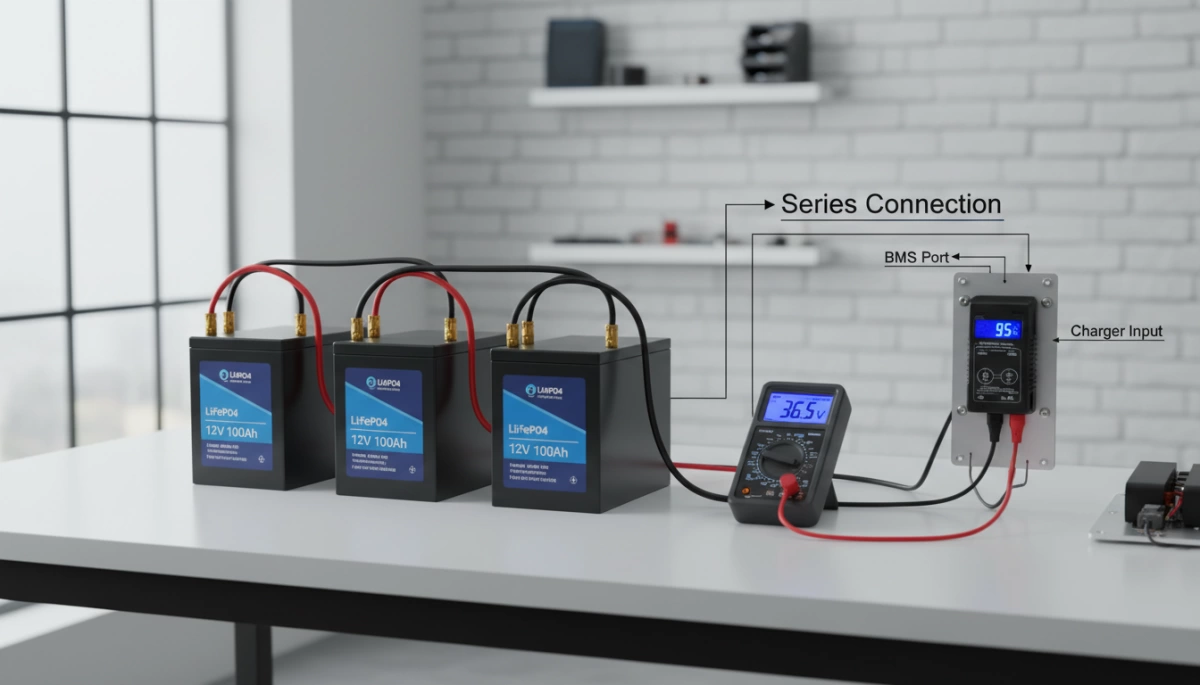
- Capacity Expansion: If your power needs grow, you can easily wire our batteries in parallel to increase your total Amp-hours.
- Voltage Scaling: For high-power applications like a trolling motor battery Group 24 setup, you can connect units in series to achieve 24V or 36V.
- Smart BMS Protection: Our integrated Smart BMS automatically manages cell balancing and protects against short circuits during installation.
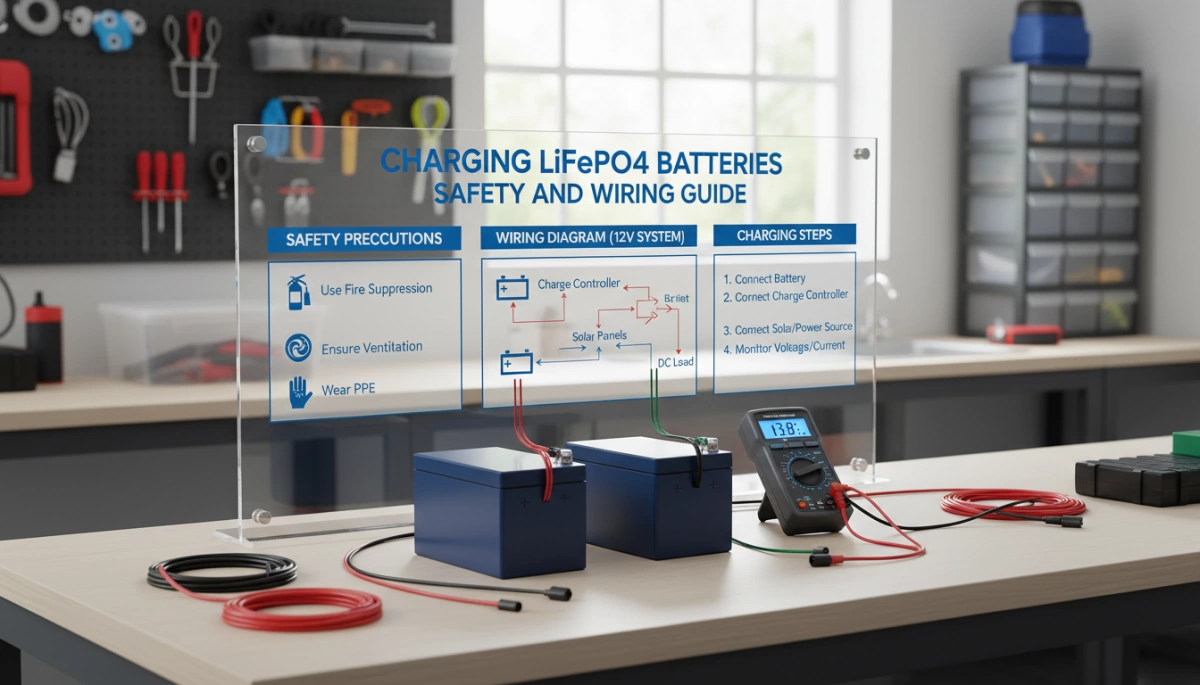
Charging Guidelines and Handling
To reach the 4,000–6,000+ cycle potential, you should use a charger specifically designed for LiFePO4 chemistry. While some AGM chargers may work, a dedicated lithium charger ensures the battery reaches 100% usable capacity without stressing the Grade A LiFePO4 cells.
- Mounting Orientation: Unlike lead-acid, these batteries can be mounted on their side or end, offering more flexibility in tight RV compartments.
- Venting Requirements: One of the biggest safety questions we receive is do LiFePO4 batteries need to be vented? In most standard applications, they do not require external venting because they do not release toxic gas during charge or discharge.
- Temperature Safety: If you operate in extreme cold, always check the internal temperature before charging. Our low-temperature heating series is recommended for users who need to charge in sub-freezing environments.
By sticking to these professional installation steps, you ensure your Group 24 LiFePO4 battery remains a reliable, maintenance-free power source for over a decade.
Maintenance Tips for Your Group 24 Battery Longevity
Why Lithium Beats Lead-Acid for Maintenance
One of the main reasons I recommend a Lithium upgrade Group 24 to our customers is the total lack of maintenance. While traditional flooded batteries require you to check water levels and clean off acid corrosion, our Group 24 LiFePO4 battery is completely sealed and maintenance-free. You don’t have to worry about venting gases or equalization charges. It is truly a “set it and forget it” power solution for your RV or boat.
Storage Recommendations and SOC Monitoring
If you want to protect your investment, how you store your deep cycle Group 24 battery matters. Unlike lead-acid, which needs to stay at 100% to avoid sulfation, lithium is happiest at a partial state of charge (SOC).
- Ideal Storage Level: Keep the battery at 50% to 60% SOC if you aren’t using it for more than a month.
- Temperature Control: Store it in a cool, dry place. Avoid freezing temperatures when the battery is completely discharged.
- BMS Monitoring: Use the integrated Smart BMS to monitor cell health. For those building custom setups, utilizing a high-quality 12.8V 80Ah 32650 LiFePO4 battery pack ensures the same stability and protection standards we build into our Group 24 units.
Maximizing Cycle Life and Knowing When to Replace
To get the full 10-year lifespan out of your battery, avoid consistently discharging it to 0%, even though lithium can handle it. Most of our users see the best results by staying within the 10% to 90% range.
When should you replace it?
- Capacity Drop: When the battery no longer holds at least 80% of its original rated capacity.
- Physical Damage: Any signs of casing bloat or terminal damage.
- BMS Alerts: If the internal management system frequently trips due to cell imbalance.
By following these simple steps, you ensure your Group 24 battery provides reliable, high-performance power for years of off-grid adventures.